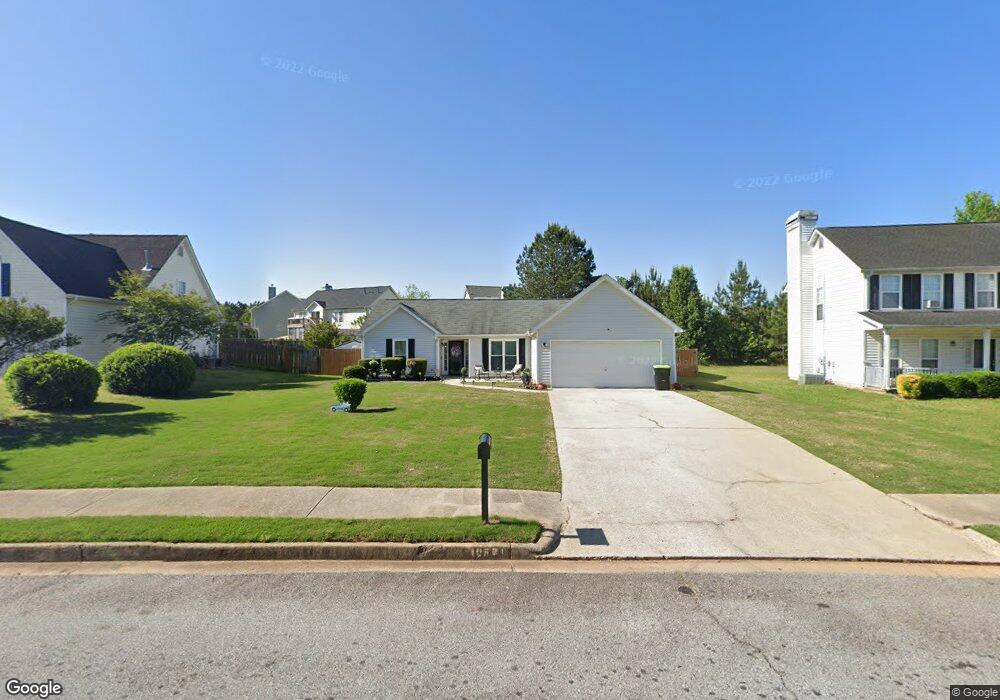
10671 Paladin Dr Hampton, GA 30228
Estimated Value: $225,000 - $275,000
3
Beds
2
Baths
1,834
Sq Ft
$136/Sq Ft
Est. Value
About This Home
This home is located at 10671 Paladin Dr, Hampton, GA 30228 and is currently estimated at $250,186, approximately $136 per square foot. 10671 Paladin Dr is a home located in Clayton County with nearby schools including Kemp Primary School, Kemp Elementary School, and Eddie White Academy.
Ownership History
Date
Name
Owned For
Owner Type
Purchase Details
Closed on
Aug 27, 2012
Sold by
Trent Patricia Ann
Bought by
Trent Patricia Ann and Trent Steffany
Current Estimated Value
Purchase Details
Closed on
Feb 15, 2011
Sold by
Hud-Housing Of Urban Dev
Bought by
Trent Patricia
Purchase Details
Closed on
Jun 1, 2010
Sold by
Bac Home Loans Servicing Lp
Bought by
Hud-Housing Of Urban Dev
Purchase Details
Closed on
Mar 19, 2009
Sold by
Hud-Housing Of Urban Dev
Bought by
Pittman Anthony B
Home Financials for this Owner
Home Financials are based on the most recent Mortgage that was taken out on this home.
Original Mortgage
$79,212
Interest Rate
5.29%
Mortgage Type
FHA
Purchase Details
Closed on
May 6, 2008
Sold by
Chase Home Finance Llc
Bought by
Hud-Housing Of Urban Dev
Purchase Details
Closed on
Jul 20, 1999
Sold by
Andrew Rhonda G
Bought by
Andrew Van A
Create a Home Valuation Report for This Property
The Home Valuation Report is an in-depth analysis detailing your home's value as well as a comparison with similar homes in the area
Home Values in the Area
Average Home Value in this Area
Purchase History
| Date | Buyer | Sale Price | Title Company |
|---|---|---|---|
| Trent Patricia Ann | -- | -- | |
| Trent Patricia | -- | -- | |
| Hud-Housing Of Urban Dev | -- | -- | |
| Bac Home Loans Servicing Lp | $75,487 | -- | |
| Pittman Anthony B | -- | -- | |
| Hud-Housing Of Urban Dev | -- | -- | |
| Chase Home Finance Llc | $158,489 | -- | |
| Andrew Van A | -- | -- |
Source: Public Records
Mortgage History
| Date | Status | Borrower | Loan Amount |
|---|---|---|---|
| Previous Owner | Pittman Anthony B | $79,212 |
Source: Public Records
Tax History
| Year | Tax Paid | Tax Assessment Tax Assessment Total Assessment is a certain percentage of the fair market value that is determined by local assessors to be the total taxable value of land and additions on the property. | Land | Improvement |
|---|---|---|---|---|
| 2025 | $3,811 | $108,520 | $8,800 | $99,720 |
| 2024 | $3,306 | $110,320 | $8,800 | $101,520 |
| 2023 | $2,299 | $106,600 | $8,800 | $97,800 |
| 2022 | $1,849 | $91,680 | $8,800 | $82,880 |
| 2021 | $1,860 | $6,400 | $6,400 | $49,739 |
| 2020 | $1,883 | $56,139 | $6,400 | $49,739 |
| 2019 | $1,911 | $56,139 | $6,400 | $49,739 |
| 2018 | $1,593 | $48,302 | $6,400 | $41,902 |
| 2017 | $526 | $22,000 | $6,400 | $15,600 |
| 2016 | $526 | $22,000 | $6,400 | $15,600 |
| 2015 | $518 | $0 | $0 | $0 |
| 2014 | $487 | $25,031 | $6,400 | $18,631 |
Source: Public Records
Map
Nearby Homes
- 10571 Starling Trail Unit II
- 10725 Barberry Dr Unit 5
- 10664 Sandpiper Rd
- 10897 Paladin Dr
- 10617 Barberry Dr
- 1429 Trellis Ct Unit (LOT 9)
- 1429 Trellis Ct
- 1441 Trellis Ct
- 1441 Trellis Ct Unit (LOT 7)
- 1605 Plover Rd
- 1578 Pintail Rd
- 1416 Trellis Ct
- 1428 Trellis Ct Unit (LOT 23)
- 1428 Trellis Ct
- 1434 Trellis Ct
- 1434 Trellis Ct Unit (LOT 24)
- 1362 Tara Rd
- 10429 Trellis Ln
- 10429 Trellis Ln Unit (LOT 29)
- 1589 Bonanza Church Rd
- 10679 Paladin Dr
- 10663 Paladin Dr Unit IV
- 106600 Paladin Dr
- 10701 Buckingham Cir Unit IV
- 10700 Buckingham Cir
- 10691 Paladin Dr Unit IV
- 10668 Paladin Dr
- 10676 Paladin Dr
- 10705 Buckingham Cir Unit IV
- 10684 Paladin Dr
- 10701 Paladin Dr
- 10706 Buckingham Cir
- 10660 Paladin Dr
- 10711 Paladin Dr
- 10711 Paladin Dr
- 10690 Paladin Dr
- 10690 Paladin Dr Unit 4
- 10653 Paladin Dr
- 1429 Trafalgar Ct
- 10714 Buckingham Cir
Your Personal Tour Guide
Ask me questions while you tour the home.