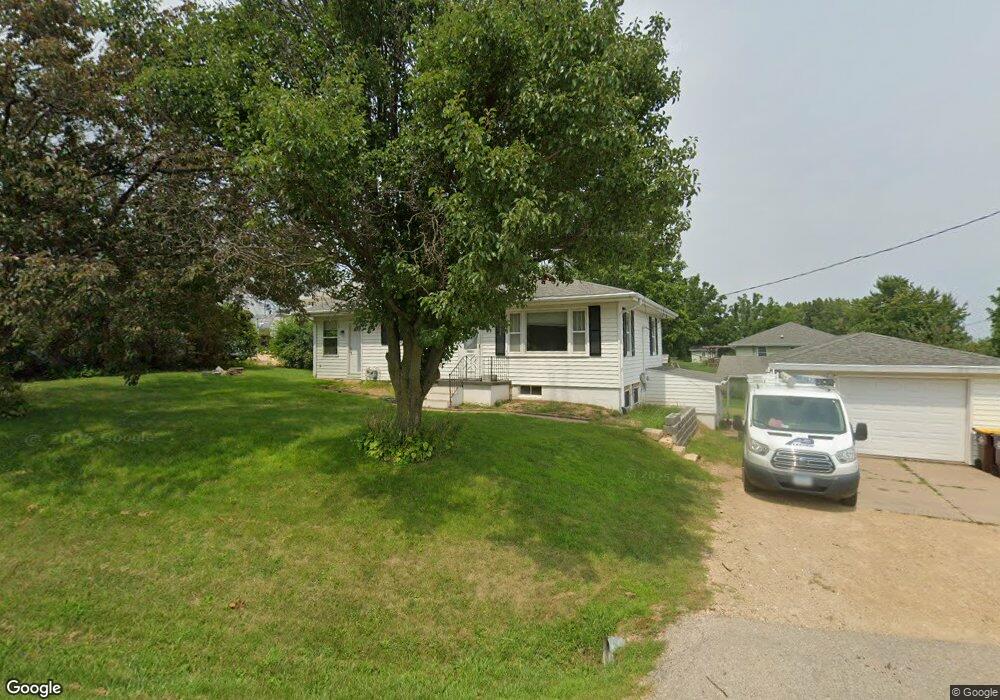
10672 Lake Eleanor Rd Dubuque, IA 52003
Estimated Value: $168,000 - $181,000
2
Beds
2
Baths
832
Sq Ft
$206/Sq Ft
Est. Value
About This Home
This home is located at 10672 Lake Eleanor Rd, Dubuque, IA 52003 and is currently estimated at $171,605, approximately $206 per square foot. 10672 Lake Eleanor Rd is a home located in Dubuque County with nearby schools including Table Mound Elementary School, Eleanor Roosevelt Middle School, and Dubuque Senior High School.
Ownership History
Date
Name
Owned For
Owner Type
Purchase Details
Closed on
Aug 10, 2023
Sold by
Moyer Benjamin L
Bought by
Capesius Justin D
Current Estimated Value
Home Financials for this Owner
Home Financials are based on the most recent Mortgage that was taken out on this home.
Original Mortgage
$122,000
Outstanding Balance
$119,168
Interest Rate
6.71%
Mortgage Type
New Conventional
Estimated Equity
$52,437
Purchase Details
Closed on
Feb 25, 2013
Sold by
Welsh Joseph J
Bought by
Moyer Benjamin L
Home Financials for this Owner
Home Financials are based on the most recent Mortgage that was taken out on this home.
Original Mortgage
$80,700
Interest Rate
3.38%
Mortgage Type
New Conventional
Purchase Details
Closed on
Oct 11, 2011
Sold by
Welsh Margaret M
Bought by
Welsh Margaret M and Welsh Joseph J
Create a Home Valuation Report for This Property
The Home Valuation Report is an in-depth analysis detailing your home's value as well as a comparison with similar homes in the area
Home Values in the Area
Average Home Value in this Area
Purchase History
| Date | Buyer | Sale Price | Title Company |
|---|---|---|---|
| Capesius Justin D | $122,000 | None Listed On Document | |
| Moyer Benjamin L | $85,000 | None Available | |
| Welsh Margaret M | -- | None Available |
Source: Public Records
Mortgage History
| Date | Status | Borrower | Loan Amount |
|---|---|---|---|
| Open | Capesius Justin D | $122,000 | |
| Previous Owner | Moyer Benjamin L | $80,700 |
Source: Public Records
Tax History Compared to Growth
Tax History
| Year | Tax Paid | Tax Assessment Tax Assessment Total Assessment is a certain percentage of the fair market value that is determined by local assessors to be the total taxable value of land and additions on the property. | Land | Improvement |
|---|---|---|---|---|
| 2025 | $1,718 | $153,000 | $34,600 | $118,400 |
| 2024 | $1,718 | $146,900 | $34,600 | $112,300 |
| 2023 | $1,446 | $146,900 | $34,600 | $112,300 |
| 2022 | $1,374 | $113,570 | $34,560 | $79,010 |
| 2021 | $1,374 | $113,570 | $34,560 | $79,010 |
| 2020 | $1,438 | $110,790 | $32,250 | $78,540 |
| 2019 | $1,354 | $110,790 | $32,250 | $78,540 |
| 2018 | $1,316 | $101,050 | $26,370 | $74,680 |
| 2017 | $1,300 | $101,050 | $26,370 | $74,680 |
| 2016 | $1,260 | $95,290 | $24,880 | $70,410 |
| 2015 | $1,260 | $95,290 | $24,880 | $70,410 |
| 2014 | $1,216 | $95,110 | $24,880 | $70,230 |
Source: Public Records
Map
Nearby Homes
- 10533 Cedar Point Ct
- 0 Digital Dr
- Lot 124 S Pointe Dr
- Lot 123 S Pointe Dr
- Lot 122 S Pointe Dr
- Lot 121 S Pointe Dr
- Lot 59 Whisper Woods Ln
- Lot 3 Autumn Ridge Ln
- Lot 12 Autumn Ridge Ln
- Lot 131 Autumn Ridge Ln
- Lot 11 Autumn Ridge Ln
- Lot 14 Autumn Ridge Ln
- Lot 10 Autumn Ridge Ln
- Lot 9 Autumn Ridge Ln
- 1380 Autumn Ridge Ln
- 2461 Whisper Woods Ln
- 1462 Autumn Ridge Ln
- 1378 Autumn Ridge Ln
- Lot 72 Waterbridge Ln
- Lot 73 Waterbridge Ln
- 10662 Lake Eleanor Rd
- 10502 Saint Joseph Dr Unit Suite 5
- 10502 Saint Joseph Dr Unit Suite 104
- 10502 Saint Joseph Dr
- 10698 Lake Eleanor Rd
- 10524 Key Dr W
- 10484 Saint Joseph Dr
- 10554 Key West Dr
- 10451 Timothy St
- 10462 Saint Joseph Dr
- 10481 Saint Joseph Dr
- 10558 Key West Dr
- 10531 Key West Dr
- 10421 Timothy St
- 10454 Saint Joseph Dr
- 10535 Key West Dr
- 10461 Saint Joseph Dr
- 10420 Key West Dr
- 10450 Timothy St
- 10453 Key West Dr