10673 Willow Ridge Loop Orlando, FL 32825
Cypress Springs NeighborhoodEstimated Value: $514,000 - $551,000
4
Beds
3
Baths
3,343
Sq Ft
$160/Sq Ft
Est. Value
About This Home
This home is located at 10673 Willow Ridge Loop, Orlando, FL 32825 and is currently estimated at $534,832, approximately $159 per square foot. 10673 Willow Ridge Loop is a home located in Orange County with nearby schools including Andover Elementary School, Legacy Middle School, and University High School.
Ownership History
Date
Name
Owned For
Owner Type
Purchase Details
Closed on
Sep 19, 2019
Sold by
Federal Home Loan Mortgage Corporation
Bought by
Hodge Roger
Current Estimated Value
Purchase Details
Closed on
Dec 27, 2018
Sold by
Us Bank Na
Bought by
Federal Home Loan Mortgage Corp
Purchase Details
Closed on
Nov 27, 2018
Sold by
Le Lucie
Bought by
U S Bank Na
Purchase Details
Closed on
Jun 3, 2014
Sold by
Ha Le Lucie
Bought by
Green Emerald Homes Llc
Purchase Details
Closed on
Jan 31, 2007
Sold by
Deluca Enterprises Inc
Bought by
Le Lucie Ha
Home Financials for this Owner
Home Financials are based on the most recent Mortgage that was taken out on this home.
Original Mortgage
$300,000
Interest Rate
6.07%
Mortgage Type
Purchase Money Mortgage
Create a Home Valuation Report for This Property
The Home Valuation Report is an in-depth analysis detailing your home's value as well as a comparison with similar homes in the area
Home Values in the Area
Average Home Value in this Area
Purchase History
| Date | Buyer | Sale Price | Title Company |
|---|---|---|---|
| Hodge Roger | $299,500 | Ras Title Llc | |
| Federal Home Loan Mortgage Corp | -- | Attorney | |
| U S Bank Na | $80,100 | None Available | |
| Green Emerald Homes Llc | $13,100 | None Available | |
| Le Lucie Ha | $375,000 | Alliance Title Services Ltd |
Source: Public Records
Mortgage History
| Date | Status | Borrower | Loan Amount |
|---|---|---|---|
| Previous Owner | Le Lucie Ha | $300,000 |
Source: Public Records
Tax History
| Year | Tax Paid | Tax Assessment Tax Assessment Total Assessment is a certain percentage of the fair market value that is determined by local assessors to be the total taxable value of land and additions on the property. | Land | Improvement |
|---|---|---|---|---|
| 2025 | $1,796 | $453,470 | -- | -- |
| 2024 | $6,878 | $440,690 | -- | -- |
| 2023 | $6,878 | $454,875 | $85,000 | $369,875 |
| 2022 | $6,125 | $390,659 | $80,000 | $310,659 |
| 2021 | $5,566 | $337,269 | $65,000 | $272,269 |
| 2020 | $4,902 | $304,883 | $55,000 | $249,883 |
| 2019 | $5,122 | $301,807 | $50,000 | $251,807 |
| 2018 | $5,050 | $293,664 | $48,500 | $245,164 |
| 2017 | $4,986 | $287,132 | $48,500 | $238,632 |
| 2016 | $4,979 | $281,837 | $55,000 | $226,837 |
| 2015 | $4,891 | $269,949 | $55,000 | $214,949 |
| 2014 | $3,962 | $224,042 | $55,000 | $169,042 |
Source: Public Records
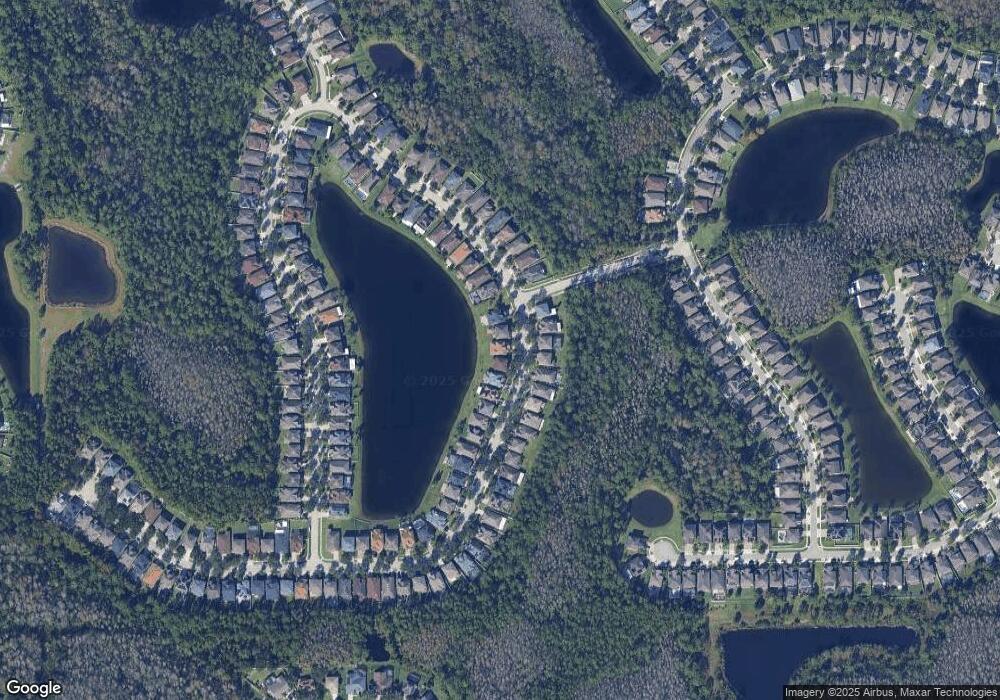
Map
Nearby Homes
- 10617 Willow Ridge Loop
- 10706 Willow Ridge Loop
- 10761 Willow Ridge Loop
- 1822 Balsam Willow Trail
- 1535 Water Elm Ct
- 10942 High Bush Ct
- 1524 Balsam Willow Trail
- 10954 High Bush Ct
- 10704 Satinwood Cir
- 1513 Balsam Willow Trail
- 10722 Clover Walk Dr
- 10752 Satinwood Cir
- 10502 Bull Grass Dr
- 1425 Amaryllis Cir
- 1990 Branchwater Trail
- 1702 Cypress Ridge Dr
- 10549 Cypress Trail Dr
- 10662 Crystal Springs Ct
- 1938 Blue Fox Ct
- 11108 Cypress Trail Dr Unit 1
- 10673 Willow Ridge Loop Unit 2
- 10685 Willow Ridge Loop Unit 2
- 10667 Willow Ridge Loop
- 10691 Willow Ridge Loop
- 10661 Willow Ridge Loop
- 10655 Willow Ridge Loop
- 10678 Willow Ridge Loop
- 10684 Willow Ridge Loop
- 10666 Willow Ridge Loop
- 10701 Willow Ridge Loop
- 10647 Willow Ridge Loop
- 10690 Willow Ridge Loop
- 10660 Willow Ridge Loop
- 10654 Willow Ridge Loop
- 10713 Willow Ridge Loop
- 10641 Willow Ridge Loop Unit 2
- 10641 Willow Ridge Loop
- 10648 Willow Ridge Loop
- 10700 Willow Ridge Loop
Your Personal Tour Guide
Ask me questions while you tour the home.