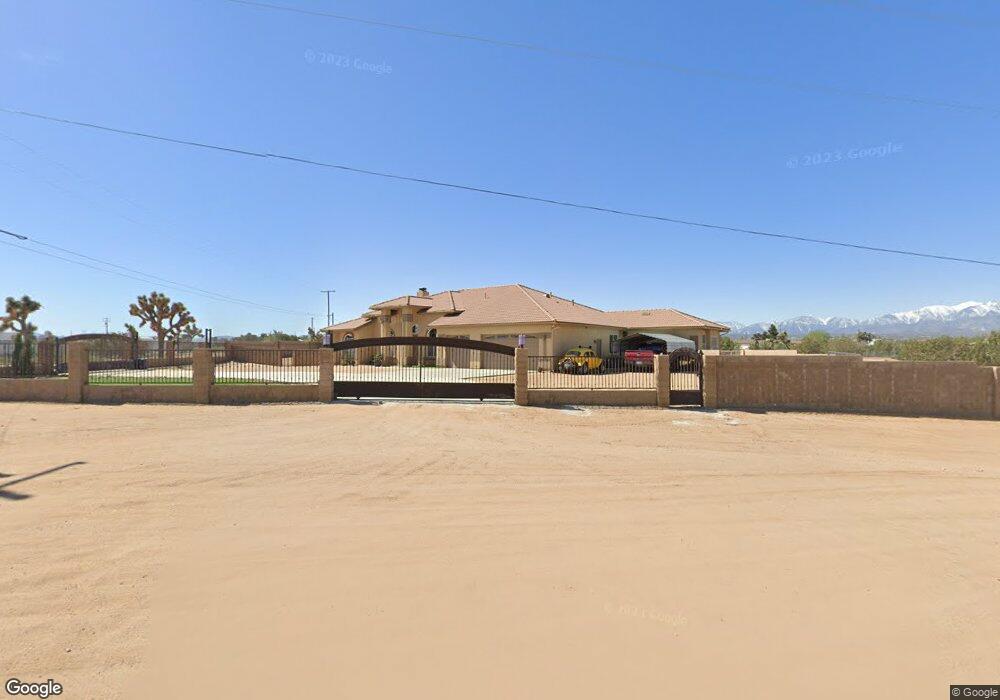
10678 Lilac Rd Oak Hills, CA 92344
Estimated Value: $646,685 - $743,000
4
Beds
3
Baths
3,217
Sq Ft
$214/Sq Ft
Est. Value
About This Home
This home is located at 10678 Lilac Rd, Oak Hills, CA 92344 and is currently estimated at $689,671, approximately $214 per square foot. 10678 Lilac Rd is a home located in San Bernardino County with nearby schools including Baldy Mesa Elementary School, Quail Valley Middle School, and Serrano High School.
Ownership History
Date
Name
Owned For
Owner Type
Purchase Details
Closed on
Oct 3, 2008
Sold by
Washington Mutual Bank
Bought by
Wabakken David J and Wabakken Latricia M
Current Estimated Value
Home Financials for this Owner
Home Financials are based on the most recent Mortgage that was taken out on this home.
Original Mortgage
$330,560
Outstanding Balance
$214,145
Interest Rate
5.9%
Mortgage Type
VA
Estimated Equity
$475,526
Purchase Details
Closed on
May 30, 2008
Sold by
Ortega Jaime
Bought by
Washington Mutual Bank
Purchase Details
Closed on
Mar 3, 2005
Sold by
Ortega Maria Elena
Bought by
Ortega Jaime
Purchase Details
Closed on
Feb 7, 2005
Sold by
Smith Tami
Bought by
Ortega Jaime
Purchase Details
Closed on
Jan 22, 2004
Sold by
Sharron Pennyann
Bought by
Smith Tami
Purchase Details
Closed on
Jul 16, 1998
Sold by
Uli Costantino
Bought by
Sharron Pennyann
Create a Home Valuation Report for This Property
The Home Valuation Report is an in-depth analysis detailing your home's value as well as a comparison with similar homes in the area
Home Values in the Area
Average Home Value in this Area
Purchase History
| Date | Buyer | Sale Price | Title Company |
|---|---|---|---|
| Wabakken David J | $320,000 | Southland Title | |
| Washington Mutual Bank | $355,500 | Fnt | |
| Ortega Jaime | -- | Chicago Title Company | |
| Ortega Jaime | $140,000 | Chicago Title Company | |
| Smith Tami | $80,500 | Chicago Title Co | |
| Sharron Pennyann | $8,500 | -- |
Source: Public Records
Mortgage History
| Date | Status | Borrower | Loan Amount |
|---|---|---|---|
| Open | Wabakken David J | $330,560 |
Source: Public Records
Tax History Compared to Growth
Tax History
| Year | Tax Paid | Tax Assessment Tax Assessment Total Assessment is a certain percentage of the fair market value that is determined by local assessors to be the total taxable value of land and additions on the property. | Land | Improvement |
|---|---|---|---|---|
| 2025 | $3,071 | $420,326 | $105,081 | $315,245 |
| 2024 | $3,071 | $412,085 | $103,021 | $309,064 |
| 2023 | $4,739 | $404,005 | $101,001 | $303,004 |
| 2022 | $4,629 | $396,084 | $99,021 | $297,063 |
| 2021 | $4,543 | $388,317 | $97,079 | $291,238 |
| 2020 | $4,487 | $384,336 | $96,084 | $288,252 |
| 2019 | $4,397 | $376,800 | $94,200 | $282,600 |
| 2018 | $4,158 | $369,412 | $92,353 | $277,059 |
| 2017 | $4,085 | $362,168 | $90,542 | $271,626 |
| 2016 | $3,998 | $355,067 | $88,767 | $266,300 |
| 2015 | $3,947 | $349,734 | $87,434 | $262,300 |
| 2014 | $3,614 | $319,700 | $64,400 | $255,300 |
Source: Public Records
Map
Nearby Homes
- 0 Kittering Rd
- 0 Lilac Rd
- 0 Mesa St Unit HD25200965
- 0 Mesa St Unit HD24171927
- 10191 Bellflower St
- 6589 Fremontia Rd
- 11727 Lamont Ct
- 0 Sage St Unit HD22086622
- 10783 Goss Rd
- 10611 Yucca Terrace Dr
- 10444 Mono Rd
- 10335 Columbine Rd
- 9955 Macron St
- 0 Fremontia Rd
- 0 Daisy Rd Unit PW24240063
- 0 Salem Rd Unit PV25108956
- 0 Merito Rd
- 11726 Calenda Ct
- 10124 Alta Mesa Rd
- 10722 Phelan Rd
- 11123 Valencia St
- 11025 Valencia St
- 10730 Lilac Rd
- 11132 Valencia St
- 11178 Valencia St
- 10611 Coleridge Rd
- 10588 Lilac Rd
- 11177 Valencia St
- 10770 Lilac Rd
- 11174 Wilmot St
- 10775 Lilac Rd
- 11165 Verde St
- 10550 Coleridge Rd
- 11175 Wilmot St
- 11239 Valencia St
- 10995 Verde St
- 0 Wilmot St Unit OC18153849
- 0 Wilmot St Unit H12066916
- 0 Wilmot St Unit CRHD24060529