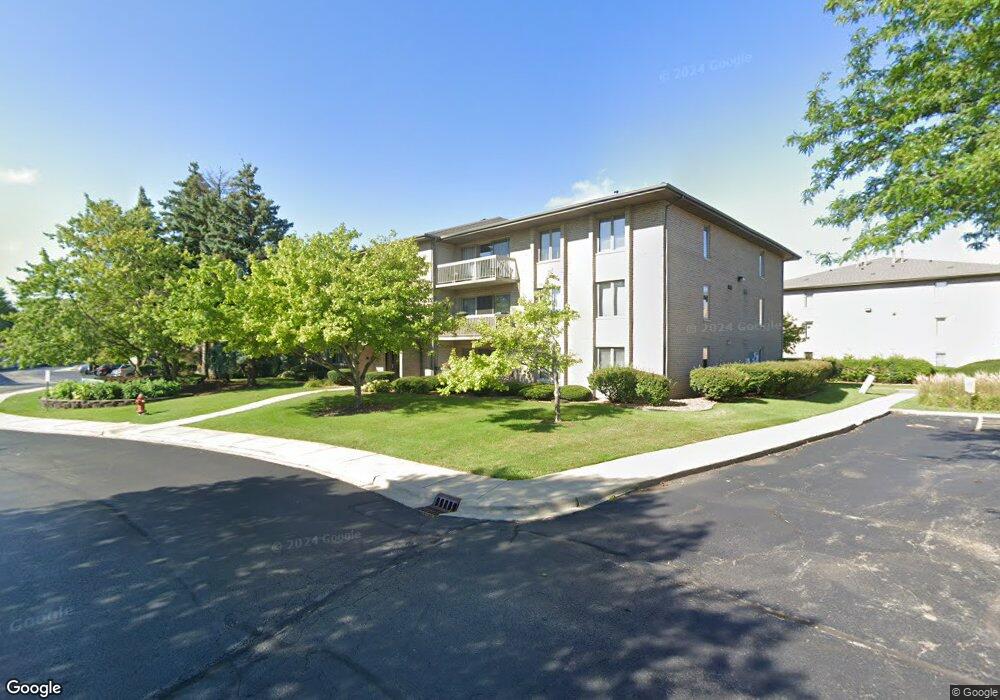
1068 Ashley Ct N Unit 11B Lockport, IL 60441
Estimated Value: $229,460 - $249,000
--
Bed
2
Baths
--
Sq Ft
1.43
Acres
About This Home
This home is located at 1068 Ashley Ct N Unit 11B, Lockport, IL 60441 and is currently estimated at $236,865. 1068 Ashley Ct N Unit 11B is a home located in Will County with nearby schools including Milne Grove Elementary School, Kelvin Grove Jr High School, and Lockport Township High School East.
Ownership History
Date
Name
Owned For
Owner Type
Purchase Details
Closed on
Dec 6, 2023
Sold by
Swalec Mark
Bought by
Guzman Eva
Current Estimated Value
Home Financials for this Owner
Home Financials are based on the most recent Mortgage that was taken out on this home.
Original Mortgage
$70,000
Outstanding Balance
$68,867
Interest Rate
7.63%
Mortgage Type
New Conventional
Estimated Equity
$167,998
Purchase Details
Closed on
Jun 4, 2019
Sold by
Jane K German Trust
Bought by
Swalec Mark
Purchase Details
Closed on
May 10, 2017
Sold by
German Jane K
Bought by
German Jane K and Jane K German Trust
Purchase Details
Closed on
Jul 2, 2003
Sold by
German Jane K and Fultz Jane K
Bought by
German Darrell E and German Jane K
Purchase Details
Closed on
Jun 30, 2000
Sold by
Dystrup Barbara F
Bought by
Fultz Fred R and Fultz Jane K
Create a Home Valuation Report for This Property
The Home Valuation Report is an in-depth analysis detailing your home's value as well as a comparison with similar homes in the area
Home Values in the Area
Average Home Value in this Area
Purchase History
| Date | Buyer | Sale Price | Title Company |
|---|---|---|---|
| Guzman Eva | $212,000 | None Listed On Document | |
| Swalec Mark | $138,000 | Chicago Title | |
| German Jane K | -- | None Available | |
| German Darrell E | -- | -- | |
| Fultz Fred R | $110,000 | Chicago Title Insurance Co |
Source: Public Records
Mortgage History
| Date | Status | Borrower | Loan Amount |
|---|---|---|---|
| Open | Guzman Eva | $70,000 |
Source: Public Records
Tax History Compared to Growth
Tax History
| Year | Tax Paid | Tax Assessment Tax Assessment Total Assessment is a certain percentage of the fair market value that is determined by local assessors to be the total taxable value of land and additions on the property. | Land | Improvement |
|---|---|---|---|---|
| 2024 | $3,582 | $57,719 | $9,131 | $48,588 |
| 2023 | $3,582 | $51,817 | $8,197 | $43,620 |
| 2022 | $3,853 | $47,857 | $7,571 | $40,286 |
| 2021 | $3,633 | $44,974 | $7,115 | $37,859 |
| 2020 | $3,530 | $43,495 | $6,881 | $36,614 |
| 2019 | $2,712 | $41,227 | $6,522 | $34,705 |
| 2018 | $2,779 | $39,641 | $6,271 | $33,370 |
| 2017 | $2,626 | $37,422 | $5,920 | $31,502 |
| 2016 | $2,702 | $37,511 | $5,934 | $31,577 |
| 2015 | $3,138 | $35,691 | $5,646 | $30,045 |
| 2014 | $3,138 | $34,652 | $5,482 | $29,170 |
| 2013 | $3,138 | $37,261 | $5,895 | $31,366 |
Source: Public Records
Map
Nearby Homes
- 1061 Ashley Ct S Unit 1A
- 1340 Lacoma Ct
- 1108 E 9th St
- 613 E 3rd St Unit 4
- 613 Katherine St
- 807 Valley Ln
- 207 Muehl Dr
- 602 Stephanie Dr
- 927 Putnam Dr
- 1007 Read St
- 540 E 4th St
- 1004 Valley Ln
- 560 E 7th St
- 1221 Runyan Dr
- 1413 Strawberry Hill Dr
- 134 S Jefferson St
- 317 Bonnie Dr
- 800 Madison St Unit 2C
- 432 E 8th St
- 1107 Garfield St
- 1068 Ashley Ct N Unit N2B
- 1068 Ashley Ct N
- 1068 Ashley Ct N Unit N3C
- 1068 Ashley Ct N Unit 3B
- 1068 Ashley Ct N Unit 3D
- 1068 Ashley Ct N Unit 2D
- 1068 Ashley Ct N Unit 3A
- 1068 Ashley Ct N Unit 1C
- 1068 Ashley Ct N Unit 12C
- 1068 Ashley Ct N Unit 1D
- 1068 Ashley Ct N Unit 1A
- 1068 Ashley Ct N Unit 2C
- 1068 Ashley Ct N Unit 2C
- 1068 Ashley Ct N Unit 3C
- 1068 Ashley Ct N Unit 2B
- 1068 Ashley Ct N Unit 1B
- 1056 Ashley Ct N Unit N2B
- 1056 Ashley Ct N Unit 21C
- 1056 Ashley Ct N Unit 3B
- 1056 Ashley Ct N Unit 2N1B