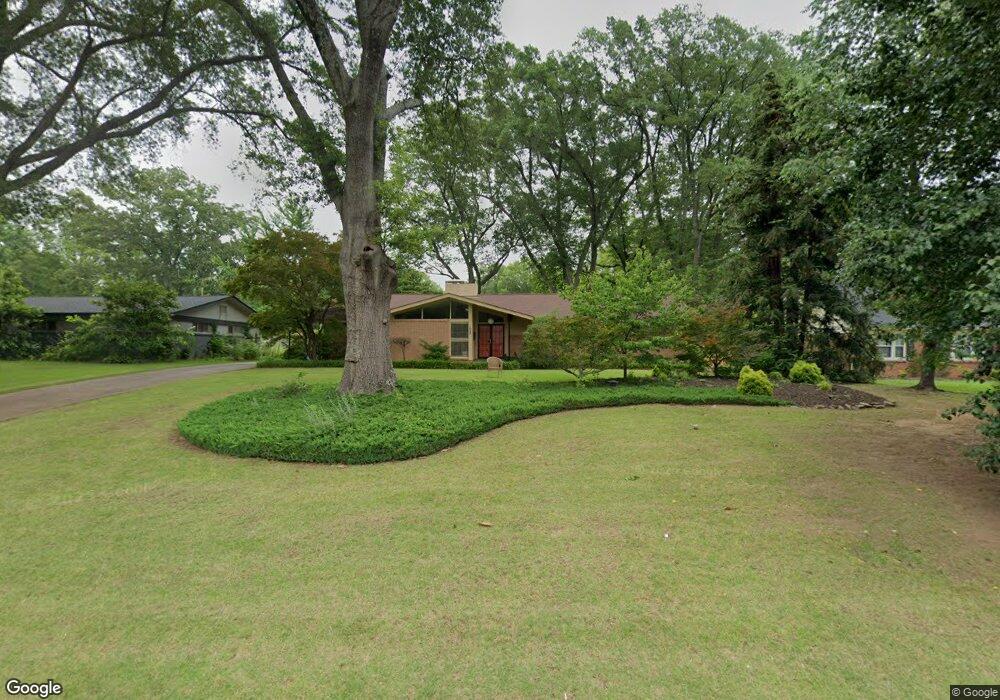
1068 Fairmeadow Rd Memphis, TN 38117
Colonial Acres NeighborhoodEstimated Value: $355,116 - $451,000
3
Beds
2
Baths
2,612
Sq Ft
$152/Sq Ft
Est. Value
About This Home
This home is located at 1068 Fairmeadow Rd, Memphis, TN 38117 and is currently estimated at $396,779, approximately $151 per square foot. 1068 Fairmeadow Rd is a home located in Shelby County with nearby schools including Sherwood Elementary School, Colonial Middle, and Overton High.
Ownership History
Date
Name
Owned For
Owner Type
Purchase Details
Closed on
Dec 31, 2020
Sold by
Ross Spang Carol E
Bought by
Ross Spang Louis Michael and Ross Spang Carol
Current Estimated Value
Purchase Details
Closed on
Oct 19, 2018
Sold by
Raburn Rickey A and Raburn Susan K
Bought by
Ross Spang Matthew R and Ross Spang Carol E
Home Financials for this Owner
Home Financials are based on the most recent Mortgage that was taken out on this home.
Original Mortgage
$199,000
Outstanding Balance
$173,909
Interest Rate
4.6%
Mortgage Type
New Conventional
Estimated Equity
$222,870
Purchase Details
Closed on
Aug 31, 2006
Sold by
Mcneely Greg A
Bought by
Raburn Rickey A and Raburn Susan K
Home Financials for this Owner
Home Financials are based on the most recent Mortgage that was taken out on this home.
Original Mortgage
$180,800
Interest Rate
6.58%
Mortgage Type
Purchase Money Mortgage
Purchase Details
Closed on
Jun 9, 2006
Sold by
Mcneely Jennifer Criswell
Bought by
Mcneely Greg A
Purchase Details
Closed on
Dec 12, 2001
Sold by
Savage Mabel M
Bought by
Mcneely Greg A and Mcneely Jennifer C
Home Financials for this Owner
Home Financials are based on the most recent Mortgage that was taken out on this home.
Original Mortgage
$201,400
Interest Rate
6.85%
Create a Home Valuation Report for This Property
The Home Valuation Report is an in-depth analysis detailing your home's value as well as a comparison with similar homes in the area
Home Values in the Area
Average Home Value in this Area
Purchase History
| Date | Buyer | Sale Price | Title Company |
|---|---|---|---|
| Ross Spang Louis Michael | -- | None Available | |
| Ross Spang Matthew R | $299,000 | Close Trak Closing & Title S | |
| Raburn Rickey A | $226,000 | None Available | |
| Mcneely Greg A | -- | Fidelity Natl Title Ins Co | |
| Mcneely Greg A | $212,000 | -- |
Source: Public Records
Mortgage History
| Date | Status | Borrower | Loan Amount |
|---|---|---|---|
| Open | Ross Spang Matthew R | $199,000 | |
| Previous Owner | Raburn Rickey A | $180,800 | |
| Previous Owner | Mcneely Greg A | $201,400 |
Source: Public Records
Tax History Compared to Growth
Tax History
| Year | Tax Paid | Tax Assessment Tax Assessment Total Assessment is a certain percentage of the fair market value that is determined by local assessors to be the total taxable value of land and additions on the property. | Land | Improvement |
|---|---|---|---|---|
| 2025 | $2,766 | $90,300 | $18,300 | $72,000 |
| 2024 | $2,766 | $81,600 | $18,300 | $63,300 |
| 2023 | $4,971 | $81,600 | $18,300 | $63,300 |
| 2022 | $4,971 | $81,600 | $18,300 | $63,300 |
| 2021 | $5,029 | $81,600 | $18,300 | $63,300 |
| 2020 | $4,065 | $56,100 | $16,875 | $39,225 |
| 2019 | $1,793 | $56,100 | $16,875 | $39,225 |
| 2018 | $1,793 | $56,100 | $16,875 | $39,225 |
| 2017 | $1,835 | $56,100 | $16,875 | $39,225 |
| 2016 | $2,257 | $51,650 | $0 | $0 |
| 2014 | $2,257 | $51,650 | $0 | $0 |
Source: Public Records
Map
Nearby Homes
- 1086 Perkins Terrace
- 4539 Kings Park Rd
- 931 Toscana Park Ct
- 1160 W Perkins Rd
- 1014 S Perkins Rd
- 4614 Perkins Cove
- 4522 Park Ave
- 4514 Park Ave
- 883 Drake Manor Cove
- 901 S Perkins Rd
- 4680 Crossover Ln
- 1229 S Perkins Rd
- 881 S Perkins Rd
- 4468 Cherrydale Rd
- 4474 Cherrydale Rd
- 1263 S Perkins Rd
- 4305 Haverhill Rd
- 1258 S Perkins Rd
- 1231 Cherrydale Cove
- 1218 Merrycrest Dr
- 1068 Fair Meadow Rd
- 1058 Fairmeadow Rd
- 1078 Fairmeadow Rd
- 1078 Fair Meadow Rd
- 1048 Fairmeadow Rd
- 1088 Fairmeadow Rd
- 1069 Kings Park Rd
- 1061 Kings Park Rd
- 1077 Kings Park Rd
- 1067 Fairmeadow Rd
- 1077 Fairmeadow Rd
- 1053 Kings Park Rd
- 1057 Fairmeadow Rd
- 1038 Fairmeadow Rd
- 1087 Kings Park Rd
- 1098 Fair Meadow Rd
- 1098 Fairmeadow Rd
- 1047 Fair Meadow Rd
- 1047 Fairmeadow Rd
- 1045 Kings Park Rd