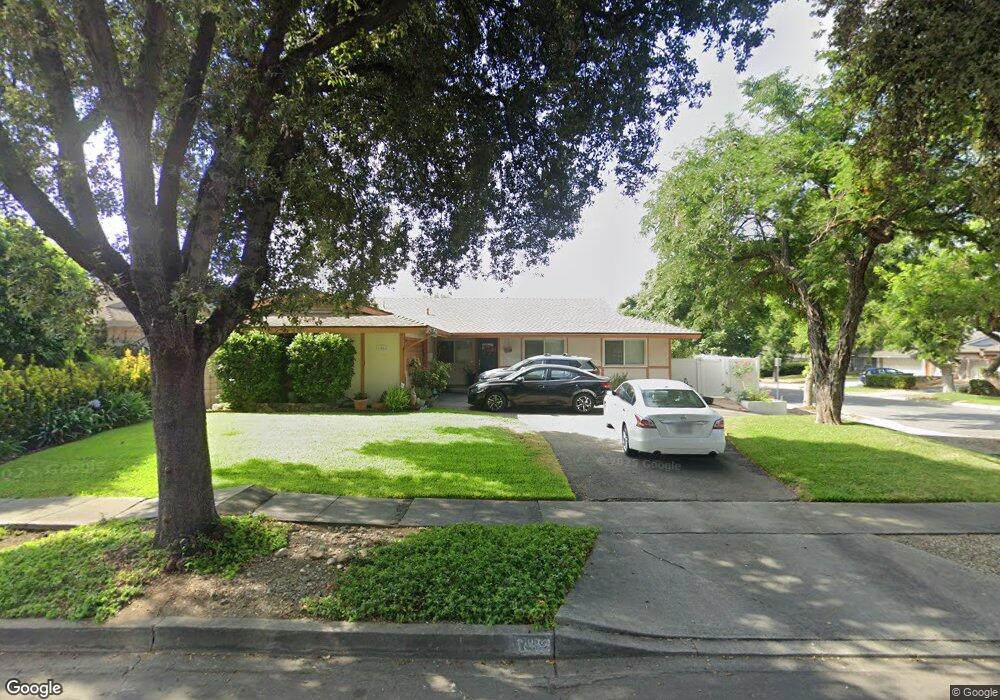
1068 Harrison Ct Upland, CA 91786
Estimated Value: $678,242 - $713,000
4
Beds
2
Baths
1,338
Sq Ft
$521/Sq Ft
Est. Value
About This Home
This home is located at 1068 Harrison Ct, Upland, CA 91786 and is currently estimated at $697,311, approximately $521 per square foot. 1068 Harrison Ct is a home located in San Bernardino County with nearby schools including Citrus Elementary, Upland Junior High School, and Upland High School.
Ownership History
Date
Name
Owned For
Owner Type
Purchase Details
Closed on
Feb 23, 2006
Sold by
Gonzalez Pablo A
Bought by
Gonzalez Lynne E
Current Estimated Value
Home Financials for this Owner
Home Financials are based on the most recent Mortgage that was taken out on this home.
Original Mortgage
$141,437
Outstanding Balance
$78,867
Interest Rate
6.04%
Mortgage Type
Credit Line Revolving
Estimated Equity
$618,444
Purchase Details
Closed on
Jul 26, 2002
Sold by
Gonzalez Pablo A and Gonzalez Lynne E
Bought by
Gonzalez Lynne E
Home Financials for this Owner
Home Financials are based on the most recent Mortgage that was taken out on this home.
Original Mortgage
$152,000
Interest Rate
6.6%
Purchase Details
Closed on
Mar 12, 1998
Sold by
Tabor Joseph E and Tabor Karen M
Bought by
Whalen Lynne Sachs
Home Financials for this Owner
Home Financials are based on the most recent Mortgage that was taken out on this home.
Original Mortgage
$135,619
Interest Rate
7.15%
Mortgage Type
FHA
Create a Home Valuation Report for This Property
The Home Valuation Report is an in-depth analysis detailing your home's value as well as a comparison with similar homes in the area
Home Values in the Area
Average Home Value in this Area
Purchase History
| Date | Buyer | Sale Price | Title Company |
|---|---|---|---|
| Gonzalez Lynne E | -- | Alliance Title | |
| Gonzalez Lynne E | -- | New Century Title Company | |
| Whalen Lynne Sachs | $138,000 | First American Title Ins Co |
Source: Public Records
Mortgage History
| Date | Status | Borrower | Loan Amount |
|---|---|---|---|
| Open | Gonzalez Lynne E | $141,437 | |
| Closed | Gonzalez Lynne E | $152,000 | |
| Closed | Whalen Lynne Sachs | $135,619 |
Source: Public Records
Tax History
| Year | Tax Paid | Tax Assessment Tax Assessment Total Assessment is a certain percentage of the fair market value that is determined by local assessors to be the total taxable value of land and additions on the property. | Land | Improvement |
|---|---|---|---|---|
| 2025 | $2,453 | $216,348 | $54,087 | $162,261 |
| 2024 | $2,374 | $212,105 | $53,026 | $159,079 |
| 2023 | $2,335 | $207,946 | $51,986 | $155,960 |
| 2022 | $2,283 | $203,869 | $50,967 | $152,902 |
| 2021 | $2,276 | $199,872 | $49,968 | $149,904 |
| 2020 | $2,213 | $197,823 | $49,456 | $148,367 |
| 2019 | $2,205 | $193,944 | $48,486 | $145,458 |
| 2018 | $2,152 | $190,141 | $47,535 | $142,606 |
| 2017 | $2,089 | $186,413 | $46,603 | $139,810 |
| 2016 | $1,904 | $182,758 | $45,689 | $137,069 |
| 2015 | $1,860 | $180,013 | $45,003 | $135,010 |
| 2014 | $1,811 | $176,486 | $44,121 | $132,365 |
Source: Public Records
Map
Nearby Homes
- 306 S Vallejo Way
- 1399 Fredericks Ln
- 1436 N Elderberry Ave
- 134 Coral Way
- 1443 Fredericks Ln
- 814 W Bonnie Brae Ct
- 126 Irving Way
- 822 W 5th St
- 1446 N Gardenia Ave
- 428 W 8th St
- 858 W Yale St
- 1549 N Oaks Ct
- 1554 N Helen Ct
- 1550 N Bonita Ct
- 1540 N Helen Ct
- 941 W Yale St
- 1335 N Elderberry Ave
- 1053 W Princeton St
- 121 Genoa Way
- 340 W Caroline Ct
- 1056 Harrison Ct
- 1069 Hampden Ct
- 1059 Hampden Ct
- 1048 Harrison Ct
- 339 Alexander Ave
- 325 Alexander Ave
- 1069 Harrison Ct
- 1059 Harrison Ct
- 1047 Hampden Ct
- 349 Alexander Ave
- 317 Alexander Ave
- 1047 Harrison Ct
- 1036 Harrison Ct
- 363 Alexander Ave
- 303 Alexander Ave
- 1037 Hampden Ct
- 1068 Hampden Ct
- 1058 Hampden Ct
- 1037 Harrison Ct
- 1070 Bennington St Unit A
Your Personal Tour Guide
Ask me questions while you tour the home.