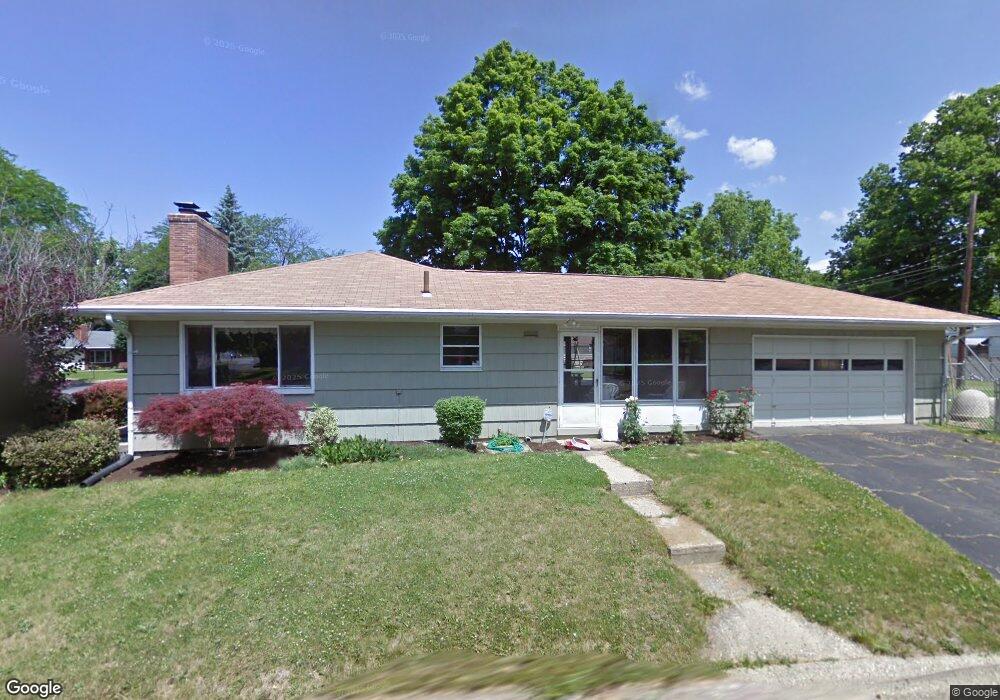
1068 Kenwick Rd Columbus, OH 43209
Eastmoor NeighborhoodEstimated Value: $253,000 - $307,000
3
Beds
1
Bath
1,458
Sq Ft
$193/Sq Ft
Est. Value
About This Home
This home is located at 1068 Kenwick Rd, Columbus, OH 43209 and is currently estimated at $281,527, approximately $193 per square foot. 1068 Kenwick Rd is a home located in Franklin County with nearby schools including Fairmoor Elementary School, Johnson Park Middle School, and Walnut Ridge High School.
Ownership History
Date
Name
Owned For
Owner Type
Purchase Details
Closed on
May 28, 2010
Sold by
Kerns Craig A and Krens Jill R
Bought by
Marshall & Isley Trust Company Na and Sara Fisher Gst Trust
Current Estimated Value
Purchase Details
Closed on
Dec 5, 2003
Sold by
Luba Thomas E and Luba Amy S
Bought by
Kerns Craig A and Maddy Jill R
Purchase Details
Closed on
Aug 17, 1998
Sold by
Bundy Gregory and Bundy Sharon S
Bought by
Luba Thomas E and Frankart Amy S
Home Financials for this Owner
Home Financials are based on the most recent Mortgage that was taken out on this home.
Original Mortgage
$79,800
Interest Rate
6.99%
Purchase Details
Closed on
Nov 14, 1989
Purchase Details
Closed on
Sep 1, 1978
Create a Home Valuation Report for This Property
The Home Valuation Report is an in-depth analysis detailing your home's value as well as a comparison with similar homes in the area
Home Values in the Area
Average Home Value in this Area
Purchase History
| Date | Buyer | Sale Price | Title Company |
|---|---|---|---|
| Marshall & Isley Trust Company Na | $124,000 | Talon Group | |
| Kerns Craig A | $123,000 | -- | |
| Luba Thomas E | $84,000 | -- | |
| -- | $71,500 | -- | |
| -- | $43,000 | -- |
Source: Public Records
Mortgage History
| Date | Status | Borrower | Loan Amount |
|---|---|---|---|
| Previous Owner | Luba Thomas E | $79,800 |
Source: Public Records
Tax History
| Year | Tax Paid | Tax Assessment Tax Assessment Total Assessment is a certain percentage of the fair market value that is determined by local assessors to be the total taxable value of land and additions on the property. | Land | Improvement |
|---|---|---|---|---|
| 2025 | $3,963 | $83,200 | $26,250 | $56,950 |
| 2024 | $3,963 | $83,200 | $26,250 | $56,950 |
| 2023 | $3,915 | $83,195 | $26,250 | $56,945 |
| 2022 | $2,242 | $42,180 | $7,950 | $34,230 |
| 2021 | $2,246 | $42,180 | $7,950 | $34,230 |
| 2020 | $2,249 | $42,180 | $7,950 | $34,230 |
| 2019 | $2,209 | $35,530 | $6,620 | $28,910 |
| 2018 | $1,103 | $35,530 | $6,620 | $28,910 |
| 2017 | $2,209 | $35,530 | $6,620 | $28,910 |
| 2016 | $2,112 | $30,350 | $7,560 | $22,790 |
| 2015 | $939 | $30,350 | $7,560 | $22,790 |
| 2014 | $1,882 | $30,350 | $7,560 | $22,790 |
| 2013 | $978 | $30,345 | $7,560 | $22,785 |
Source: Public Records
Map
Nearby Homes
- 2820 Eastminster Rd
- 2676 Tudor Rd
- 878 Grandon Ave
- 905 Vernon Rd
- 789 Chelsea Ave
- 1057-1059 S James Rd
- 1106 S James Rd
- 1423 Cottingham Ct E
- 1341 Millerdale Rd
- 2981 Templeton Rd
- 2393-2395 Dover Rd
- 1048 S James Rd
- 2947 E Mound St
- 2433 Brookwood Rd
- 712 Chelsea Ave
- 928 S Ashburton Rd
- 1042 S Hampton Rd
- 661 S Cassingham Rd
- 824 S Ashburton Rd
- 669 Brookside Dr
- 1056 Kenwick Rd
- 1080 Kenwick Rd
- 1046 Kenwick Rd
- 1042 Kenwick Rd
- 1088 Kenwick Rd
- 2744 Eastminster Rd
- 1081 Kenwick Rd
- 1032 Kenwick Rd
- 1069 Kenwick Rd
- 1063 Kenwick Rd
- 1075 Kenwick Rd
- 2739 Eastminster Rd
- 1055 Kenwick Rd
- 2727 Parkland Place
- 2750 Eastminster Rd
- 1094 Kenwick Rd
- 1045 Kenwick Rd
- 2747 Eastminster Rd
- 2737 Parkland Place
- 2745 Parkland Place
Your Personal Tour Guide
Ask me questions while you tour the home.