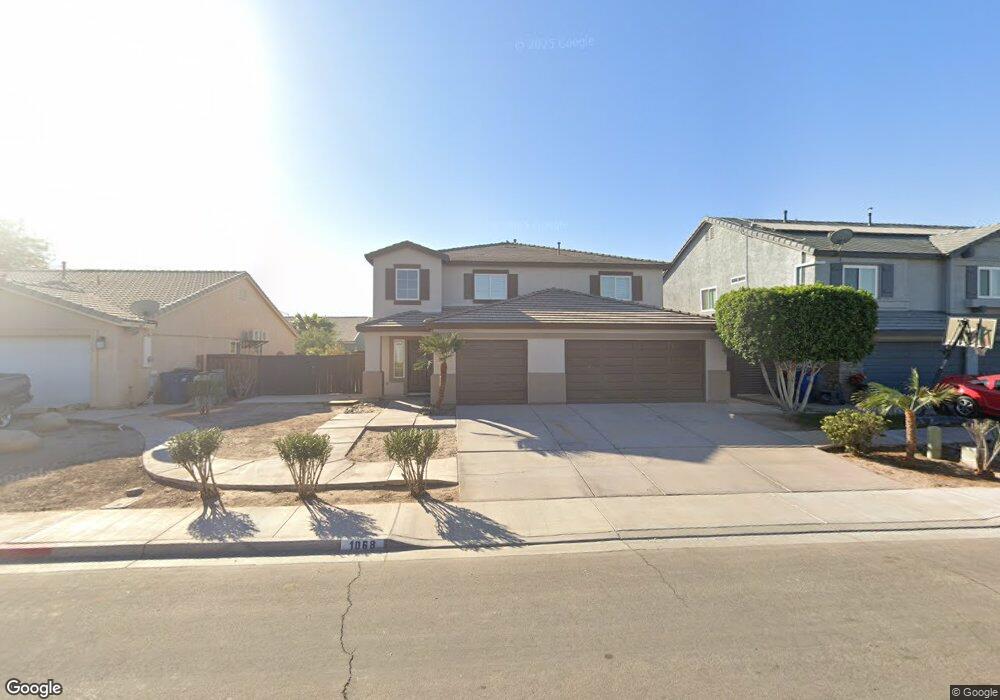
1068 Spud Moreno St Calexico, CA 92231
Estimated Value: $509,865 - $615,000
5
Beds
3
Baths
3,097
Sq Ft
$178/Sq Ft
Est. Value
About This Home
This home is located at 1068 Spud Moreno St, Calexico, CA 92231 and is currently estimated at $551,716, approximately $178 per square foot. 1068 Spud Moreno St is a home located in Imperial County with nearby schools including Kennedy Gardens Elementary School, William Moreno Junior High School, and Calexico High School.
Ownership History
Date
Name
Owned For
Owner Type
Purchase Details
Closed on
Sep 15, 2010
Sold by
Hearthstone Model Homes Llc
Bought by
Castillo Faviola
Current Estimated Value
Home Financials for this Owner
Home Financials are based on the most recent Mortgage that was taken out on this home.
Original Mortgage
$222,010
Interest Rate
4.28%
Mortgage Type
FHA
Purchase Details
Closed on
May 8, 2006
Sold by
Christal Gloria Heilman
Bought by
Hearthstone Model Homes Llc
Home Financials for this Owner
Home Financials are based on the most recent Mortgage that was taken out on this home.
Original Mortgage
$356,076
Interest Rate
6.52%
Mortgage Type
Purchase Money Mortgage
Purchase Details
Closed on
Jan 9, 2006
Sold by
Pcc La Jolla Palms Llc
Bought by
Christal Gloria Heilman
Create a Home Valuation Report for This Property
The Home Valuation Report is an in-depth analysis detailing your home's value as well as a comparison with similar homes in the area
Home Values in the Area
Average Home Value in this Area
Purchase History
| Date | Buyer | Sale Price | Title Company |
|---|---|---|---|
| Castillo Faviola | $225,000 | Chicago Title Company | |
| Castillo Faviola | $225,000 | Chicago Title Company | |
| Hearthstone Model Homes Llc | $119,000 | Chicago Title Co | |
| Christal Gloria Heilman | $475,000 | Chicago Title Co |
Source: Public Records
Mortgage History
| Date | Status | Borrower | Loan Amount |
|---|---|---|---|
| Previous Owner | Castillo Faviola | $222,010 | |
| Previous Owner | Hearthstone Model Homes Llc | $356,076 |
Source: Public Records
Tax History Compared to Growth
Tax History
| Year | Tax Paid | Tax Assessment Tax Assessment Total Assessment is a certain percentage of the fair market value that is determined by local assessors to be the total taxable value of land and additions on the property. | Land | Improvement |
|---|---|---|---|---|
| 2025 | $6,252 | $309,519 | $38,430 | $271,089 |
| 2023 | $6,252 | $297,502 | $36,939 | $260,563 |
| 2022 | $6,741 | $291,669 | $36,215 | $255,454 |
| 2021 | $6,601 | $285,951 | $35,505 | $250,446 |
| 2020 | $6,463 | $283,019 | $35,141 | $247,878 |
| 2019 | $6,309 | $277,470 | $34,452 | $243,018 |
| 2018 | $6,265 | $272,030 | $33,777 | $238,253 |
| 2017 | $6,032 | $266,697 | $33,115 | $233,582 |
| 2016 | $5,895 | $261,468 | $32,466 | $229,002 |
| 2015 | $5,853 | $257,542 | $31,979 | $225,563 |
| 2014 | $5,779 | $252,498 | $31,353 | $221,145 |
Source: Public Records
Map
Nearby Homes
- 1084 Spud Moreno St
- 1036 Playa Del Norte
- 0 E Cole Rd Unit Lot 1 250029524
- 125 E Cole Rd
- 2242 I Yturralde Dr
- 2212 I Yturralde Dr
- 2117 Descanso Dr
- 1237 R Tamayo St
- 2186 G Woo Ave
- 1900 Rancho Frontera Ave Unit F44
- 1900 Rancho Frontera Ave Unit H59
- 2204 Madison Ct
- 1268 J B Rodriguez St
- 1252 Fiesta Ave
- 105 John Kennedy St
- 1966 Clinton Ave
- 1245 C N Perry Rd
- 2208 John Jay Ave
- 1214 C N Perry Rd
- 0 Avenida de Oro
- 1072 Spud Moreno St
- 1064 Spud Moreno St
- 1065 F Torres St
- 1076 Spud Moreno St
- 1069 F Torres St
- 1061 F Torres St
- PENDING Spud Moreno St
- 1057 F Torres St
- 1073 F Torres St
- 1080 Spud Moreno St
- 1069 Spud Moreno St
- 1073 Spud Moreno St
- 1053 F Torres St
- 1065 Spud Moreno St
- 1077 Spud Moreno St
- 1077 F Torres St
- 1057 Spud Moreno St
- 1081 Spud Moreno St
- 1049 F Torres St
- 1064 F Torres St