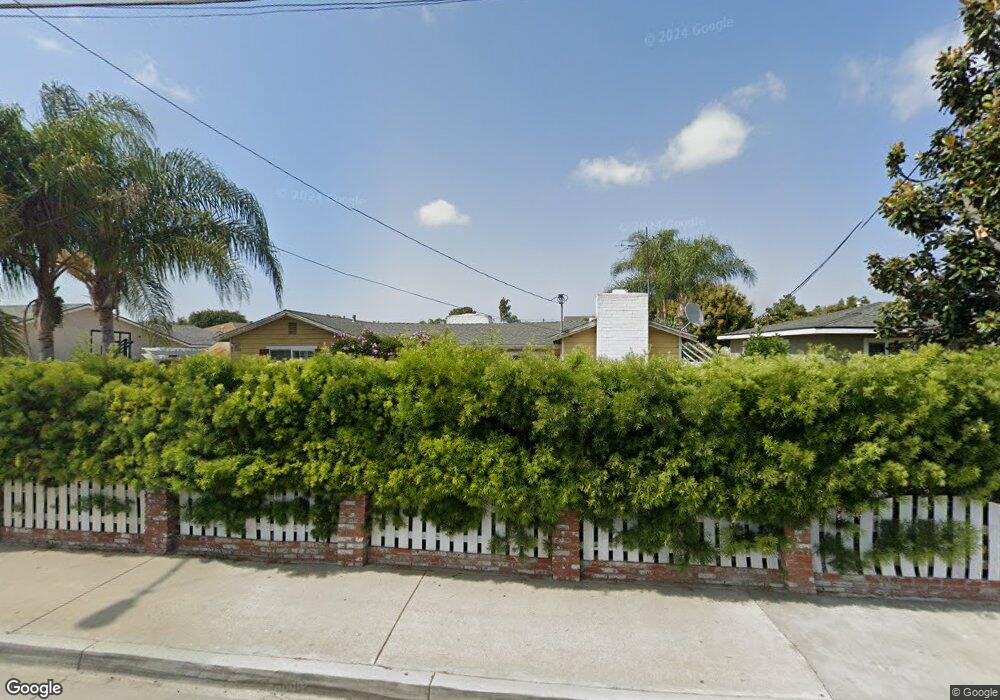
10681 Lampson Ave Garden Grove, CA 92840
Estimated Value: $964,000 - $1,378,000
3
Beds
3
Baths
1,549
Sq Ft
$742/Sq Ft
Est. Value
About This Home
This home is located at 10681 Lampson Ave, Garden Grove, CA 92840 and is currently estimated at $1,149,480, approximately $742 per square foot. 10681 Lampson Ave is a home located in Orange County with nearby schools including Ethel M. Evans Elementary School, Garden Grove High School, and St. Columban School.
Ownership History
Date
Name
Owned For
Owner Type
Purchase Details
Closed on
Mar 3, 2021
Sold by
Pham Tam Minh and Do Nhung Thu
Bought by
The Family Revocable Living Trust
Current Estimated Value
Purchase Details
Closed on
Sep 16, 2005
Sold by
Pham Tam Minh
Bought by
Pham Tam Minh and Do Nhung Thu
Purchase Details
Closed on
Nov 16, 2001
Sold by
Ninh Dzung
Bought by
Pham Tam Minh
Home Financials for this Owner
Home Financials are based on the most recent Mortgage that was taken out on this home.
Original Mortgage
$208,000
Outstanding Balance
$80,397
Interest Rate
6.57%
Estimated Equity
$1,069,083
Purchase Details
Closed on
Oct 25, 2001
Sold by
Alday Jay and Alday Betty Jane
Bought by
Pham Tam Minh
Home Financials for this Owner
Home Financials are based on the most recent Mortgage that was taken out on this home.
Original Mortgage
$208,000
Outstanding Balance
$80,397
Interest Rate
6.57%
Estimated Equity
$1,069,083
Create a Home Valuation Report for This Property
The Home Valuation Report is an in-depth analysis detailing your home's value as well as a comparison with similar homes in the area
Home Values in the Area
Average Home Value in this Area
Purchase History
| Date | Buyer | Sale Price | Title Company |
|---|---|---|---|
| The Family Revocable Living Trust | -- | Accommodation | |
| Pham Tam Minh | -- | -- | |
| Pham Tam Minh | -- | Fidelity National Title | |
| Pham Tam Minh | $260,000 | Gateway Title |
Source: Public Records
Mortgage History
| Date | Status | Borrower | Loan Amount |
|---|---|---|---|
| Open | Pham Tam Minh | $208,000 |
Source: Public Records
Tax History Compared to Growth
Tax History
| Year | Tax Paid | Tax Assessment Tax Assessment Total Assessment is a certain percentage of the fair market value that is determined by local assessors to be the total taxable value of land and additions on the property. | Land | Improvement |
|---|---|---|---|---|
| 2025 | $5,559 | $444,277 | $277,501 | $166,776 |
| 2024 | $5,559 | $435,566 | $272,060 | $163,506 |
| 2023 | $5,456 | $427,026 | $266,726 | $160,300 |
| 2022 | $5,341 | $418,653 | $261,496 | $157,157 |
| 2021 | $5,284 | $410,445 | $256,369 | $154,076 |
| 2020 | $5,215 | $406,237 | $253,740 | $152,497 |
| 2019 | $5,116 | $398,272 | $248,765 | $149,507 |
| 2018 | $5,014 | $390,463 | $243,887 | $146,576 |
| 2017 | $4,946 | $382,807 | $239,105 | $143,702 |
| 2016 | $4,702 | $375,301 | $234,416 | $140,885 |
| 2015 | $4,637 | $369,664 | $230,895 | $138,769 |
| 2014 | $4,526 | $362,423 | $226,372 | $136,051 |
Source: Public Records
Map
Nearby Homes
- 10560 Lakeside Dr N Unit B
- 10580 Lakeside Dr N Unit E
- 10521 Lakeside Dr S Unit I
- 10520 Lakeside Dr N Unit L
- 10541 Lakeside Dr S Unit P
- 10442 Lampson Ave
- 12555 S Euclid St Unit 32
- 12555 Euclid St Unit 79
- 12555 Euclid St Unit 61
- 12256 Lesley St
- 11052 Peppertree Ln
- 12332 Euclid St
- 12600 Euclid St Unit 19
- 11081 Iris Dr
- 12262 Morrie Ln
- 12071 Diane St
- 11102 Avolencia Place
- 10371 Garden Grove Blvd Unit 16
- 10371 Garden Grove Blvd Unit 20
- 10882 Chapman Ave
- 10671 Lampson Ave
- 10691 Lampson Ave
- 12428 Frieda Place
- 12432 Frieda Place
- 10661 Lampson Ave
- 12441 Nelson St
- 10701 Lampson Ave
- 10682 Lampson Ave
- 10672 Lampson Ave
- 10692 Lampson Ave
- 12422 Frieda Place
- 10662 Lampson Ave
- 10712 Lampson Ave
- 10721 Lampson Ave
- 12431 Nelson St
- 10642 Lampson Ave
- 10722 Lampson Ave
- 12451 Frieda Place
- 10681 Claussen St
- 12441 Frieda Place