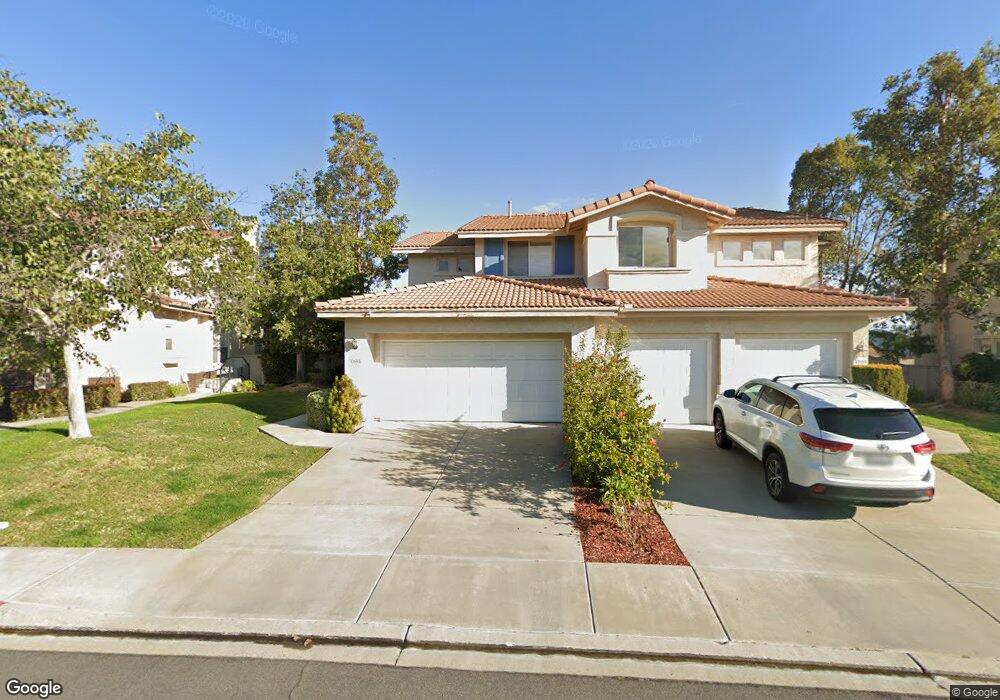
10684 Cassowary Ct Unit 4A San Diego, CA 92131
Miramar Ranch North NeighborhoodEstimated Value: $1,014,000 - $1,193,000
2
Beds
3
Baths
1,264
Sq Ft
$866/Sq Ft
Est. Value
About This Home
This home is located at 10684 Cassowary Ct Unit 4A, San Diego, CA 92131 and is currently estimated at $1,094,117, approximately $865 per square foot. 10684 Cassowary Ct Unit 4A is a home located in San Diego County with nearby schools including Dingeman Elementary School, Thurgood Marshall Middle School, and Scripps Ranch High School.
Ownership History
Date
Name
Owned For
Owner Type
Purchase Details
Closed on
May 15, 2002
Sold by
Lafave Anne M
Bought by
Simpson Lucy M
Current Estimated Value
Home Financials for this Owner
Home Financials are based on the most recent Mortgage that was taken out on this home.
Original Mortgage
$136,500
Interest Rate
6.6%
Purchase Details
Closed on
Jan 12, 2000
Sold by
Trang Chau H
Bought by
Lafave Anne M
Home Financials for this Owner
Home Financials are based on the most recent Mortgage that was taken out on this home.
Original Mortgage
$178,400
Interest Rate
7.87%
Purchase Details
Closed on
Aug 23, 1994
Sold by
D R Horton Inc San Diego
Bought by
Trang Chau H
Home Financials for this Owner
Home Financials are based on the most recent Mortgage that was taken out on this home.
Original Mortgage
$127,800
Interest Rate
4.5%
Create a Home Valuation Report for This Property
The Home Valuation Report is an in-depth analysis detailing your home's value as well as a comparison with similar homes in the area
Home Values in the Area
Average Home Value in this Area
Purchase History
| Date | Buyer | Sale Price | Title Company |
|---|---|---|---|
| Simpson Lucy M | $346,000 | Commonwealth Land Title Co | |
| Lafave Anne M | $223,000 | Fidelity National Title | |
| Trang Chau H | $160,000 | Chicago Title Co |
Source: Public Records
Mortgage History
| Date | Status | Borrower | Loan Amount |
|---|---|---|---|
| Previous Owner | Simpson Lucy M | $136,500 | |
| Previous Owner | Lafave Anne M | $178,400 | |
| Previous Owner | Trang Chau H | $127,800 | |
| Closed | Lafave Anne M | $44,600 |
Source: Public Records
Tax History Compared to Growth
Tax History
| Year | Tax Paid | Tax Assessment Tax Assessment Total Assessment is a certain percentage of the fair market value that is determined by local assessors to be the total taxable value of land and additions on the property. | Land | Improvement |
|---|---|---|---|---|
| 2025 | $6,366 | $501,102 | $217,240 | $283,862 |
| 2024 | $6,366 | $491,278 | $212,981 | $278,297 |
| 2023 | $6,214 | $481,646 | $208,805 | $272,841 |
| 2022 | $5,984 | $472,203 | $204,711 | $267,492 |
| 2021 | $5,929 | $462,946 | $200,698 | $262,248 |
| 2020 | $5,860 | $458,200 | $198,641 | $259,559 |
| 2019 | $5,937 | $449,217 | $194,747 | $254,470 |
| 2018 | $6,003 | $440,410 | $190,929 | $249,481 |
| 2017 | $80 | $431,776 | $187,186 | $244,590 |
| 2016 | $5,807 | $423,311 | $183,516 | $239,795 |
| 2015 | $5,733 | $416,954 | $180,760 | $236,194 |
| 2014 | $5,650 | $408,788 | $177,220 | $231,568 |
Source: Public Records
Map
Nearby Homes
- 10818 Caminito Arcada
- 11629 Swan Lake Dr Unit 4
- 10941 Waterton Rd
- 10914 Ivy Hill Dr Unit 1
- 11482 Cortina Place
- 11365 Affinity Ct Unit 192
- 11215 Affinity Ct Unit 80
- 9960 Scripps Vista Way Unit 116
- 11265 Affinity Ct Unit 103
- 12490 Heatherton Ct Unit 8
- 11175 Affinity Ct Unit 45
- 9819 Kika Ct
- 11235 Affinity Ct Unit 68
- 11856 Miro Cir
- 11825 Miro Cir
- 11325 Affinity Ct Unit 151
- 11115 Affinity Ct Unit 1
- 12530 Heatherton Ct Unit 31
- 10978 Serafina Ln Unit 69
- 11121 Catarina Ln Unit 73
- 10678 Cassowary Ct Unit 4A
- 10688 Cassowary Ct Unit 4A
- 10672 Cassowary Ct
- 10692 Cassowary Ct
- 10673 Eglantine Ct
- 10681 Eglantine Ct Unit 4A
- 10671 Eglantine Ct
- 10685 Eglantine Ct
- 10664 Cassowary Ct
- 10667 Eglantine Ct
- 10696 Cassowary Ct
- 10691 Eglantine Ct Unit 4A
- 10675 Cassowary Ct
- 10661 Eglantine Ct
- 11748 Ramsdell Ct
- 10695 Eglantine Ct
- 10660 Cassowary Ct
- 10659 Eglantine Ct
- 11742 Ramsdell Ct
- 10697 Eglantine Ct