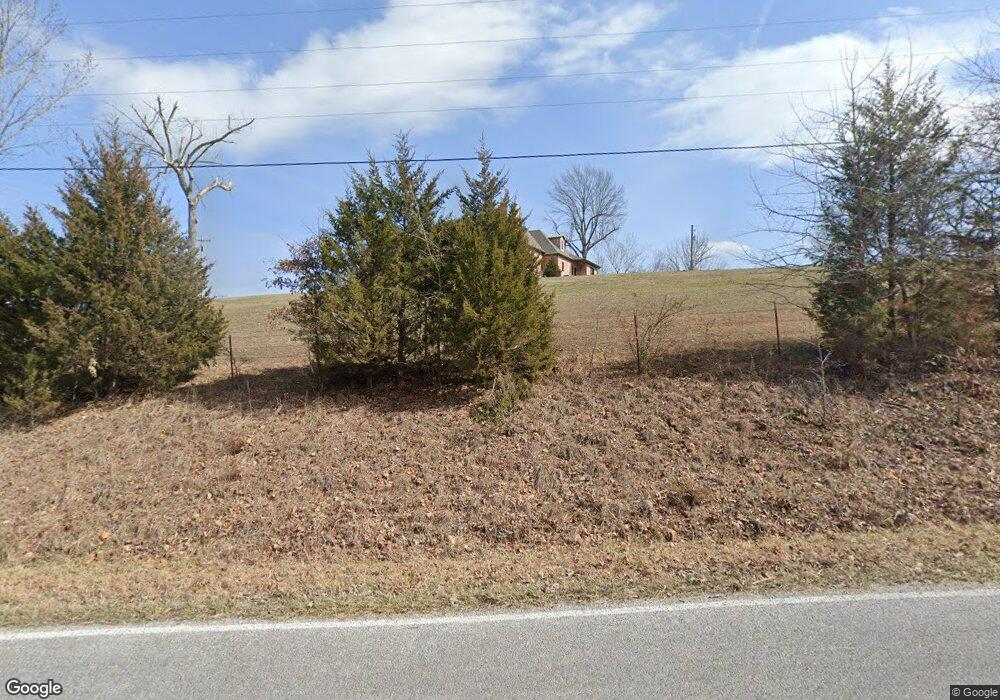
10686 Ervin McGarrah Rd Lowell, AR 72745
Estimated Value: $561,000 - $1,417,026
--
Bed
2
Baths
5,700
Sq Ft
$174/Sq Ft
Est. Value
About This Home
This home is located at 10686 Ervin McGarrah Rd, Lowell, AR 72745 and is currently estimated at $989,013, approximately $173 per square foot. 10686 Ervin McGarrah Rd is a home located in Benton County with nearby schools including Lowell Elementary School, Kirksey Middle School, and Rogers High School.
Ownership History
Date
Name
Owned For
Owner Type
Purchase Details
Closed on
Sep 16, 2015
Sold by
Bf Residential Holdings Llc
Bought by
Hoover Don J and Bedford Hoover Cari L
Current Estimated Value
Purchase Details
Closed on
Feb 13, 2014
Sold by
Bedford Tonya L
Bought by
Bf Residential Holdings Llc
Purchase Details
Closed on
Oct 6, 2004
Bought by
Bedford Tr
Purchase Details
Closed on
Aug 13, 2004
Bought by
Bedford
Purchase Details
Closed on
Aug 6, 2004
Bought by
Bedford Tr
Purchase Details
Closed on
Jan 15, 1999
Bought by
King
Purchase Details
Closed on
Jun 12, 1998
Bought by
Stroope Stroope 5 and Stroope 79Ac
Purchase Details
Closed on
Oct 11, 1996
Bought by
Arnold
Purchase Details
Closed on
Jan 27, 1995
Bought by
Kinder
Purchase Details
Closed on
May 22, 1973
Bought by
Poling
Create a Home Valuation Report for This Property
The Home Valuation Report is an in-depth analysis detailing your home's value as well as a comparison with similar homes in the area
Home Values in the Area
Average Home Value in this Area
Purchase History
| Date | Buyer | Sale Price | Title Company |
|---|---|---|---|
| Hoover Don J | -- | Attorney | |
| Bf Residential Holdings Llc | -- | None Available | |
| Bedford Tr | $164,000 | -- | |
| Bedford | $164,000 | -- | |
| Bedford Tr | $164,000 | -- | |
| Bedford | $164,000 | -- | |
| King | $93,000 | -- | |
| Stroope Stroope 5 | $38,000 | -- | |
| Arnold | $60,000 | -- | |
| Kinder | $40,000 | -- | |
| Poling | $30,000 | -- |
Source: Public Records
Tax History Compared to Growth
Tax History
| Year | Tax Paid | Tax Assessment Tax Assessment Total Assessment is a certain percentage of the fair market value that is determined by local assessors to be the total taxable value of land and additions on the property. | Land | Improvement |
|---|---|---|---|---|
| 2025 | $11,232 | $278,286 | $25,306 | $252,980 |
| 2024 | $9,710 | $278,286 | $25,306 | $252,980 |
| 2023 | $8,828 | $183,530 | $11,860 | $171,670 |
| 2022 | $9,489 | $183,530 | $11,860 | $171,670 |
| 2021 | $9,463 | $183,530 | $11,860 | $171,670 |
| 2020 | $547 | $10,600 | $9,230 | $1,370 |
| 2019 | $1,322 | $25,620 | $9,230 | $16,390 |
| 2018 | $1,322 | $25,620 | $9,230 | $16,390 |
| 2017 | $1,232 | $25,620 | $9,230 | $16,390 |
| 2016 | $1,232 | $25,620 | $9,230 | $16,390 |
| 2015 | $1,230 | $25,580 | $10,540 | $15,040 |
| 2014 | $1,230 | $25,580 | $10,540 | $15,040 |
Source: Public Records
Map
Nearby Homes
- 10729 Anzac Dr
- 11246 Ervin McGarrah Rd
- 11250 Ervin McGarrah Rd
- 14472 S Mountain Rd
- 13734 Canal St
- 10237 Bordeaux Rd
- 14600 S Mountain Rd
- 14044 Villera Dr
- 10177 Bonnabel Rd
- 0 La Harpe Rd Unit 1315983
- 0 Lopez Dr
- 14431 Horseshoe Ln
- Tract 61 Horseshoe Ln
- 0 Sycamore Rd
- 14076 Canal St
- 2.46 Acres Monte Northeast Estates Dr
- 14090 Canal St
- 10010 Bobwhite Cir
- 15100 Railroad Cut Rd
- 9936 Old Campbell Rd
- Lot 10 Edens Bluff Dr
- L4 Edens Bluff Dr
- L10 Edens Bluff Dr
- L3 Edens Bluff Dr
- 10674 Ervin McGarrah Rd
- 10735 Ervin McGarrah Rd
- L7 Edens Bluff Dr
- 10735 Ervin McGarrah Rd
- L1 Edens Bluff Ln
- 10878 Ervin McGarrah Rd
- 14214 Edens Bluff Ln
- 14203 Edens Bluff Ln
- 10689 Ervin McGarrah Rd
- 14213 Edens Bluff Dr
- 10651 Ervin McGarrah Rd
- L2 Edens Bluff Ln
- 14227 Edens Bluff Ln
- 14225 Edens Bluff Dr
- 10669 Ervin McGarrah Rd
- 10655 Ervin McGarrah Rd