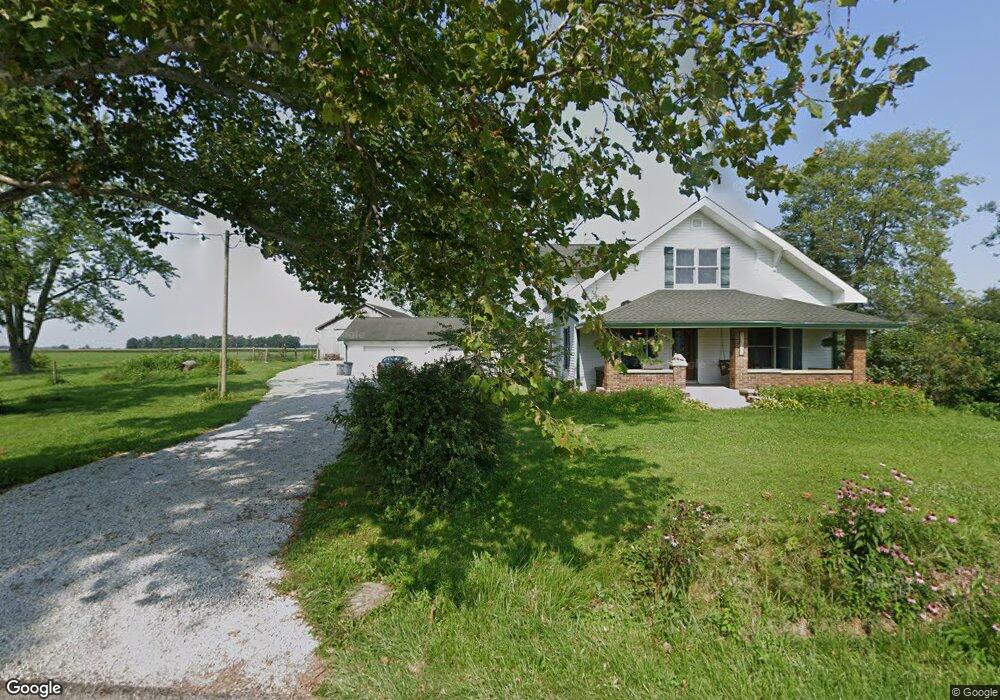
10689 N Division Rd Fountaintown, IN 46130
Estimated Value: $499,030 - $700,000
3
Beds
3
Baths
2,547
Sq Ft
$219/Sq Ft
Est. Value
About This Home
This home is located at 10689 N Division Rd, Fountaintown, IN 46130 and is currently estimated at $558,758, approximately $219 per square foot. 10689 N Division Rd is a home located in Shelby County with nearby schools including Morristown Elementary School and Morristown Junior/Senior High School.
Ownership History
Date
Name
Owned For
Owner Type
Purchase Details
Closed on
Aug 25, 2023
Sold by
Carpenter Holly
Bought by
Waymire Brandon M and Waymire Abbey N
Current Estimated Value
Home Financials for this Owner
Home Financials are based on the most recent Mortgage that was taken out on this home.
Original Mortgage
$450,500
Outstanding Balance
$440,518
Interest Rate
6.96%
Mortgage Type
New Conventional
Estimated Equity
$118,240
Purchase Details
Closed on
May 14, 2019
Sold by
Carpenter Kyle and Carpenter Holly
Bought by
Carpenter Holly
Purchase Details
Closed on
Nov 12, 2010
Sold by
Davis Edward
Bought by
Carpenter Holly and Carpenter Kyle
Home Financials for this Owner
Home Financials are based on the most recent Mortgage that was taken out on this home.
Original Mortgage
$303,952
Interest Rate
4.16%
Mortgage Type
New Conventional
Create a Home Valuation Report for This Property
The Home Valuation Report is an in-depth analysis detailing your home's value as well as a comparison with similar homes in the area
Home Values in the Area
Average Home Value in this Area
Purchase History
| Date | Buyer | Sale Price | Title Company |
|---|---|---|---|
| Waymire Brandon M | -- | None Listed On Document | |
| Carpenter Holly | -- | None Available | |
| Carpenter Holly | $320,000 | -- | |
| Carpenter Kyle | -- | -- |
Source: Public Records
Mortgage History
| Date | Status | Borrower | Loan Amount |
|---|---|---|---|
| Open | Waymire Brandon M | $450,500 | |
| Previous Owner | Carpenter Kyle | $303,952 |
Source: Public Records
Tax History Compared to Growth
Tax History
| Year | Tax Paid | Tax Assessment Tax Assessment Total Assessment is a certain percentage of the fair market value that is determined by local assessors to be the total taxable value of land and additions on the property. | Land | Improvement |
|---|---|---|---|---|
| 2024 | $2,999 | $355,200 | $23,100 | $332,100 |
| 2023 | $3,122 | $352,900 | $22,300 | $330,600 |
| 2022 | $3,203 | $339,600 | $21,400 | $318,200 |
| 2021 | $2,414 | $279,200 | $21,000 | $258,200 |
| 2020 | $2,241 | $268,900 | $20,900 | $248,000 |
| 2019 | $1,977 | $245,000 | $21,000 | $224,000 |
| 2018 | $1,766 | $223,900 | $21,100 | $202,800 |
| 2017 | $1,605 | $215,300 | $21,600 | $193,700 |
| 2016 | $1,557 | $222,500 | $21,900 | $200,600 |
| 2014 | $1,429 | $212,600 | $21,000 | $191,600 |
| 2013 | $1,429 | $206,400 | $19,700 | $186,700 |
Source: Public Records
Map
Nearby Homes
- 10686 N Division Rd
- 11131 N State Road 9
- 256 E 1000 N
- 11497 N State Road 9
- 83 E Walnut St
- 11600 N 100 E
- 6 U S 52
- 5 U S 52
- 1898 E 1000 N
- 5555 S 200 E
- 0 S 300 East- 2
- 1069 W Railroad St
- 5477 S Main St
- 661 W 500 S
- 5465 S Greenfield St
- 1744 E 850 N
- 10812 N Blue River Trail
- 1546 E Osprey Dr
- 11546 N Shelby 300 W
- 10618 N 300 E
- 10652 N Division Rd
- 10707 N Division Rd
- 10560 N Division Rd
- 10871 N Division Rd
- 10860 N Private Road 23 W
- 10860 N Private 23 W
- 10733 N Division Rd
- 10911 N Division Rd
- 10861 N Private Road 23 W
- 10861 N Private Road 23 W
- 10411 N Division Rd
- 10969 N Division Rd
- 10760 N Private 23 W
- 10760 Npr23w Dr
- 44 W 1100 N
- 265 W 1100 N
- 142 W 1100 N
- 168 W 1100 N
- 11081 N Division Rd
- 208 W 1100 N