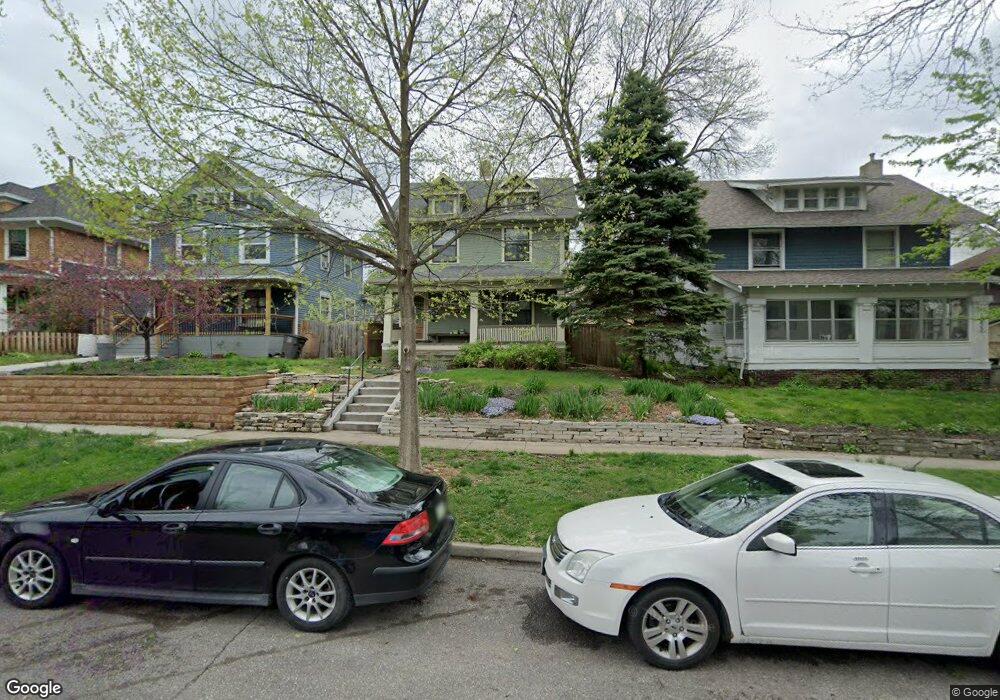
1069 27th St Des Moines, IA 50311
Drake NeighborhoodEstimated Value: $253,000 - $300,000
2
Beds
2
Baths
1,968
Sq Ft
$140/Sq Ft
Est. Value
About This Home
This home is located at 1069 27th St, Des Moines, IA 50311 and is currently estimated at $275,974, approximately $140 per square foot. 1069 27th St is a home located in Polk County with nearby schools including Hubbell Elementary and Roosevelt High School.
Ownership History
Date
Name
Owned For
Owner Type
Purchase Details
Closed on
Sep 15, 2010
Sold by
Wilke Brown Patrick D and Wilke Brown Monica L
Bought by
Wilke Brown Patrick D and Wilke Brown Monica L
Current Estimated Value
Home Financials for this Owner
Home Financials are based on the most recent Mortgage that was taken out on this home.
Original Mortgage
$159,049
Outstanding Balance
$106,665
Interest Rate
4.75%
Mortgage Type
FHA
Estimated Equity
$169,309
Purchase Details
Closed on
Aug 2, 2006
Sold by
Historic Homes Lc
Bought by
Wilke Monica L and Brown Patrick D
Home Financials for this Owner
Home Financials are based on the most recent Mortgage that was taken out on this home.
Original Mortgage
$136,000
Interest Rate
6.82%
Mortgage Type
Purchase Money Mortgage
Purchase Details
Closed on
Apr 11, 2006
Sold by
James Development Group Inc
Bought by
Historic Homes Lc
Home Financials for this Owner
Home Financials are based on the most recent Mortgage that was taken out on this home.
Original Mortgage
$152,000
Interest Rate
6.34%
Mortgage Type
Purchase Money Mortgage
Purchase Details
Closed on
Jan 31, 2006
Sold by
Campbell John R
Bought by
James Development Group Inc
Purchase Details
Closed on
Mar 26, 2002
Sold by
Daniels Preston A and Daniels Patricia A
Bought by
Campbell John R
Create a Home Valuation Report for This Property
The Home Valuation Report is an in-depth analysis detailing your home's value as well as a comparison with similar homes in the area
Home Values in the Area
Average Home Value in this Area
Purchase History
| Date | Buyer | Sale Price | Title Company |
|---|---|---|---|
| Wilke Brown Patrick D | -- | None Available | |
| Wilke Monica L | $154,500 | None Available | |
| Historic Homes Lc | $66,000 | Itc | |
| James Development Group Inc | $64,500 | None Available | |
| Campbell John R | $25,500 | -- |
Source: Public Records
Mortgage History
| Date | Status | Borrower | Loan Amount |
|---|---|---|---|
| Open | Wilke Brown Patrick D | $159,049 | |
| Closed | Wilke Monica L | $136,000 | |
| Previous Owner | Historic Homes Lc | $152,000 |
Source: Public Records
Tax History Compared to Growth
Tax History
| Year | Tax Paid | Tax Assessment Tax Assessment Total Assessment is a certain percentage of the fair market value that is determined by local assessors to be the total taxable value of land and additions on the property. | Land | Improvement |
|---|---|---|---|---|
| 2025 | $4,414 | $275,900 | $21,400 | $254,500 |
| 2024 | $4,414 | $234,800 | $18,400 | $216,400 |
| 2023 | $4,038 | $234,800 | $18,400 | $216,400 |
| 2022 | $4,006 | $180,200 | $14,900 | $165,300 |
| 2021 | $3,788 | $180,200 | $14,900 | $165,300 |
| 2020 | $3,930 | $160,400 | $13,200 | $147,200 |
| 2019 | $4,116 | $160,400 | $13,200 | $147,200 |
| 2018 | $4,070 | $161,700 | $10,200 | $151,500 |
| 2017 | $2,038 | $161,700 | $10,200 | $151,500 |
| 2016 | $1,982 | $148,900 | $9,200 | $139,700 |
| 2015 | $1,982 | $148,900 | $9,200 | $139,700 |
| 2014 | $1,716 | $140,900 | $8,600 | $132,300 |
Source: Public Records
Map
Nearby Homes
- 1071 27th St
- 1059 27th St
- 1073 27th St
- 2615 Kingman Blvd
- 2621 Kingman Blvd
- 1077 27th St
- 1060 26th St
- 1056 26th St
- 1064 27th St
- 1052 26th St
- 1070 26th St
- 1083 27th St
- 1070 27th St
- 1074 26th St
- 2707 Kingman Blvd
- 1072 27th St
- 1072 27th St Unit 5
- 1072 27th St Unit 2
- 2600 Cottage Grove Ave
- 2640 Cottage Grove Ave