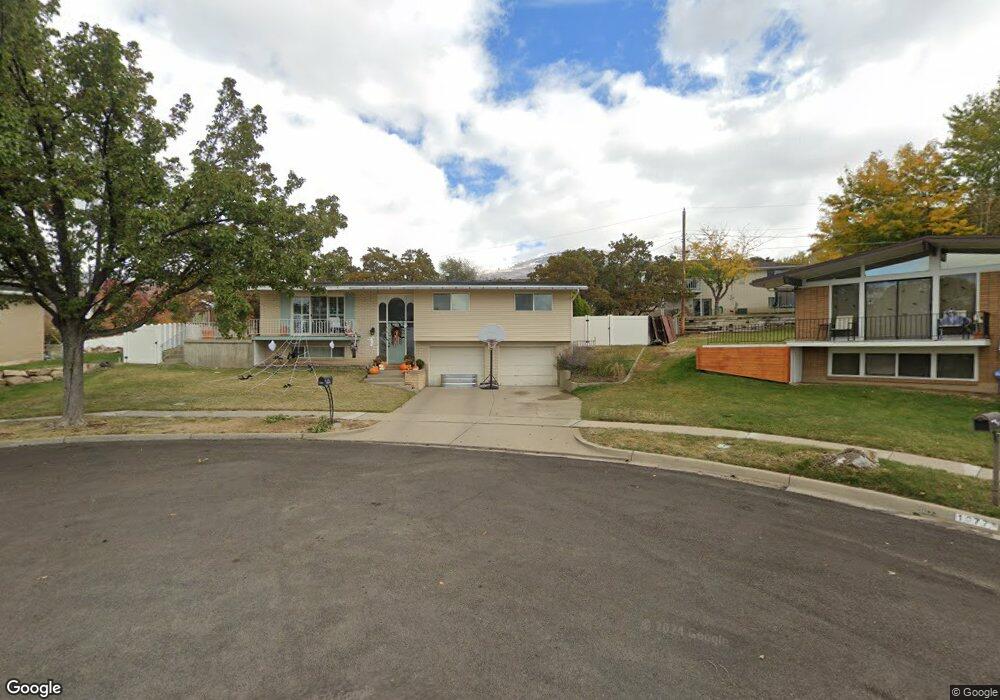
1069 Arlington Way Bountiful, UT 84010
Estimated Value: $570,083 - $651,000
3
Beds
2
Baths
1,287
Sq Ft
$462/Sq Ft
Est. Value
About This Home
This home is located at 1069 Arlington Way, Bountiful, UT 84010 and is currently estimated at $594,771, approximately $462 per square foot. 1069 Arlington Way is a home located in Davis County with nearby schools including Valley View School, Mueller Park Junior High School, and Bountiful High School.
Ownership History
Date
Name
Owned For
Owner Type
Purchase Details
Closed on
May 3, 2005
Sold by
King Kelly E and King Sydneyt H
Bought by
Aller Matt and Aller Teresa
Current Estimated Value
Purchase Details
Closed on
Jan 17, 2002
Sold by
Lauti John F
Bought by
Lauti John F and Lauti Heather Dawn
Home Financials for this Owner
Home Financials are based on the most recent Mortgage that was taken out on this home.
Original Mortgage
$162,450
Interest Rate
6.84%
Mortgage Type
FHA
Purchase Details
Closed on
Oct 28, 1997
Sold by
Tanner Gregory Douglas and Andreason Brenda Lynn Tanner
Bought by
Luddington Stephen and Luddington Kimberly
Home Financials for this Owner
Home Financials are based on the most recent Mortgage that was taken out on this home.
Original Mortgage
$146,200
Interest Rate
7.36%
Create a Home Valuation Report for This Property
The Home Valuation Report is an in-depth analysis detailing your home's value as well as a comparison with similar homes in the area
Purchase History
| Date | Buyer | Sale Price | Title Company |
|---|---|---|---|
| Aller Matt | -- | None Available | |
| Lauti John F | -- | Bonneville Title Company Inc | |
| Lauti John F | -- | Bonneville Title Company Inc | |
| Luddington Stephen | -- | Backman Stewart Title Servic |
Source: Public Records
Mortgage History
| Date | Status | Borrower | Loan Amount |
|---|---|---|---|
| Previous Owner | Lauti John F | $162,450 | |
| Previous Owner | Luddington Stephen | $146,200 |
Source: Public Records
Tax History
| Year | Tax Paid | Tax Assessment Tax Assessment Total Assessment is a certain percentage of the fair market value that is determined by local assessors to be the total taxable value of land and additions on the property. | Land | Improvement |
|---|---|---|---|---|
| 2025 | $3,446 | $271,150 | $164,279 | $106,871 |
| 2024 | $3,146 | $262,900 | $151,071 | $111,829 |
| 2023 | $3,034 | $459,000 | $279,124 | $179,876 |
| 2022 | $3,103 | $262,900 | $149,364 | $113,536 |
| 2021 | $2,684 | $343,000 | $222,448 | $120,552 |
| 2020 | $2,434 | $304,000 | $202,434 | $101,566 |
| 2019 | $2,384 | $302,000 | $187,988 | $114,012 |
| 2018 | $2,146 | $272,000 | $176,143 | $95,857 |
| 2016 | $1,869 | $127,215 | $60,951 | $66,264 |
| 2015 | $1,822 | $116,710 | $60,951 | $55,759 |
| 2014 | $1,779 | $117,334 | $60,951 | $56,383 |
| 2013 | -- | $113,937 | $55,030 | $58,907 |
Source: Public Records
Map
Nearby Homes
- 1087 Arlington Way
- 1888 S 1150 E
- 994 Deborah Dr
- 2156 Elaine Dr
- 2136 S 900 E
- 1785 1450 E
- 775 E 1500 S
- 1761 S Davis Blvd
- 2115 S Ridgewood Way
- 795 Abby Ln Unit 5
- 831 E San Simeon Way S
- 631 E 1700 S
- 761 San Simeon Way
- 861 E Millbrook Way
- 1987 Mapleview Dr
- 1885 Spring Creek Dr
- 1735 S Temple Ct Unit 203
- 1596 E Millbrook Way
- 1886 S Jeri Dr
- 0 Bountiful Blvd
- 1832 S 1150 E
- 1059 Arlington Way
- 1077 Arlington Way
- 1846 S 1150 E
- 1818 S 1150 E
- 1051 Arlington Way
- 1860 S 1150 E
- 1843 Arlington Way
- 1043 Arlington Way
- 1817 S 1150 E
- 1157 E 1850 S
- 1035 Arlington Way
- 1865 S 1150 E
- 1857 Arlington Way
- 1086 Arlington Way
- 1062 Arlington Way
- 1850 Arlington Way
- 1885 S 1150 E
- 1164 Mueller Park Rd
- 1040 Arlington Way
Your Personal Tour Guide
Ask me questions while you tour the home.