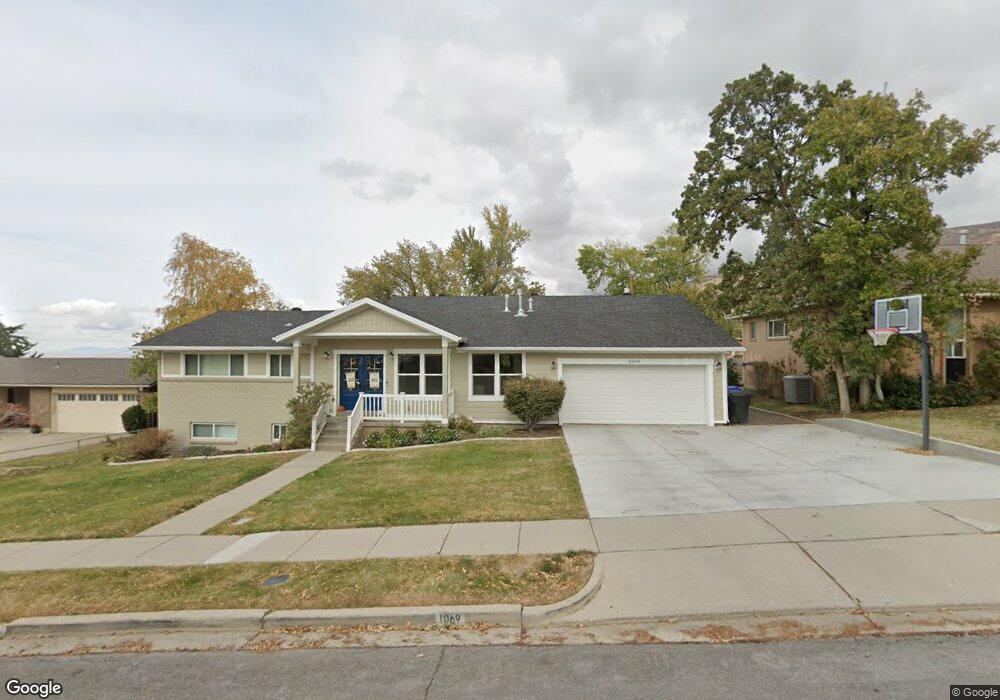
1069 E 75 S Bountiful, UT 84010
Estimated Value: $599,000 - $663,000
4
Beds
3
Baths
1,788
Sq Ft
$354/Sq Ft
Est. Value
About This Home
This home is located at 1069 E 75 S, Bountiful, UT 84010 and is currently estimated at $632,928, approximately $353 per square foot. 1069 E 75 S is a home located in Davis County with nearby schools including Holbrook Elementary School, Millcreek Junior High School, and Bountiful High School.
Ownership History
Date
Name
Owned For
Owner Type
Purchase Details
Closed on
May 26, 2004
Sold by
Harper James L and Harper Erica J
Bought by
Terry Jason and Terry Kimberly
Current Estimated Value
Home Financials for this Owner
Home Financials are based on the most recent Mortgage that was taken out on this home.
Original Mortgage
$148,800
Outstanding Balance
$71,528
Interest Rate
5.86%
Mortgage Type
Purchase Money Mortgage
Estimated Equity
$561,400
Purchase Details
Closed on
Apr 4, 2002
Sold by
Hulme Melvin J and Hulme Joy N
Bought by
Harper James L and Harper Erica J
Home Financials for this Owner
Home Financials are based on the most recent Mortgage that was taken out on this home.
Original Mortgage
$147,250
Interest Rate
6.78%
Purchase Details
Closed on
Oct 27, 1997
Sold by
Hulme Melvin J and Hulme Joy N
Bought by
Hulme Melvin J and Hulme Joy N
Create a Home Valuation Report for This Property
The Home Valuation Report is an in-depth analysis detailing your home's value as well as a comparison with similar homes in the area
Purchase History
| Date | Buyer | Sale Price | Title Company |
|---|---|---|---|
| Terry Jason | -- | Bonneville Title Company Inc | |
| Harper James L | -- | Bonneville Title Company Inc | |
| Hulme Melvin J | -- | -- |
Source: Public Records
Mortgage History
| Date | Status | Borrower | Loan Amount |
|---|---|---|---|
| Open | Terry Jason | $148,800 | |
| Previous Owner | Harper James L | $147,250 | |
| Closed | Terry Jason | $27,900 |
Source: Public Records
Tax History
| Year | Tax Paid | Tax Assessment Tax Assessment Total Assessment is a certain percentage of the fair market value that is determined by local assessors to be the total taxable value of land and additions on the property. | Land | Improvement |
|---|---|---|---|---|
| 2025 | $3,667 | $335,500 | $137,851 | $197,649 |
| 2024 | $3,453 | $326,700 | $127,037 | $199,663 |
| 2023 | $3,414 | $587,000 | $231,155 | $355,845 |
| 2022 | $3,576 | $337,700 | $123,201 | $214,499 |
| 2021 | $3,217 | $465,000 | $183,182 | $281,818 |
| 2020 | $2,822 | $409,000 | $166,779 | $242,221 |
| 2019 | $2,249 | $313,000 | $162,482 | $150,518 |
| 2018 | $2,098 | $287,000 | $151,181 | $135,819 |
| 2016 | $1,704 | $125,455 | $49,008 | $76,447 |
| 2015 | $1,668 | $115,885 | $49,008 | $66,877 |
| 2014 | $1,572 | $112,079 | $49,008 | $63,071 |
| 2013 | -- | $88,702 | $56,343 | $32,359 |
Source: Public Records
Map
Nearby Homes
- 551 N 1100 E
- 683 E 100 N
- 1105 E 600 N
- 1023 E 800 N
- 908 Northern Hills Dr
- 975 E 1050 N
- 1342 Northridge Dr
- 345 N 400 E
- 1342 E Skyline Dr N Unit 30
- 111 Eagle Ridge Dr
- 520 S Orchard Dr Unit 17
- 861 E Millbrook Way
- 453 N 400 E Unit 7-D
- 323 Peach Ln
- 337 Peach Ln
- 275 E Peach Ln S
- 662 E 1200 N
- 0 Lot Bountiful Blvd
- 795 Abby Ln Unit 5
- 545 S 100 E
Your Personal Tour Guide
Ask me questions while you tour the home.