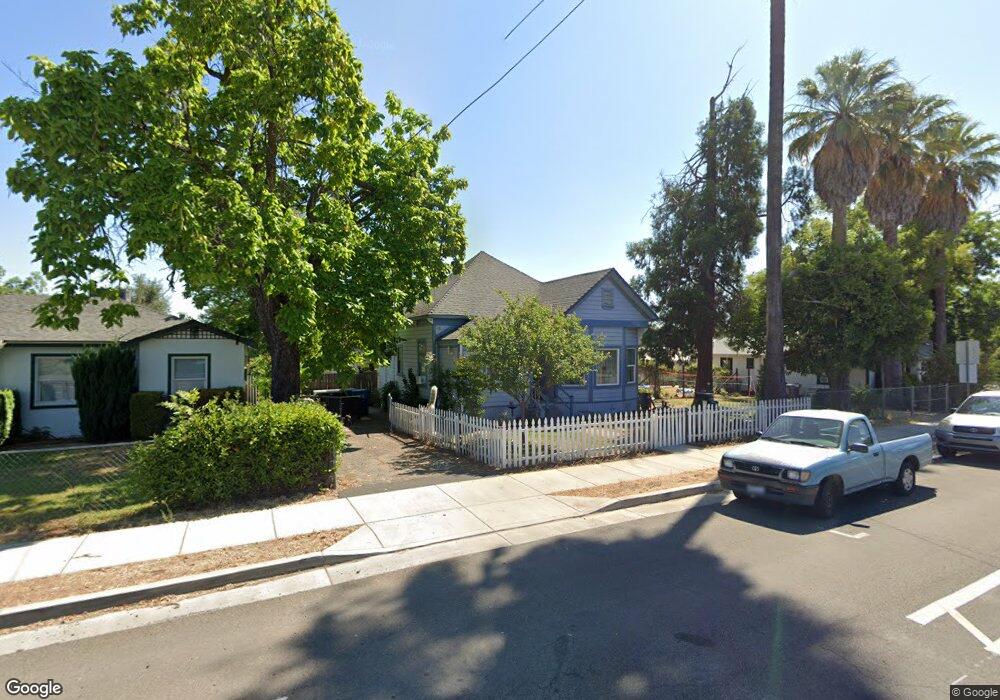
1069 West St Redding, CA 96001
Lakeview NeighborhoodEstimated Value: $227,000 - $294,000
2
Beds
1
Bath
1,270
Sq Ft
$199/Sq Ft
Est. Value
About This Home
This home is located at 1069 West St, Redding, CA 96001 and is currently estimated at $253,086, approximately $199 per square foot. 1069 West St is a home located in Shasta County with nearby schools including Manzanita Elementary School, Sequoia Middle School, and Shasta High School.
Ownership History
Date
Name
Owned For
Owner Type
Purchase Details
Closed on
Jan 9, 2003
Sold by
Hodges Douglas L and Hodges Rita G
Bought by
Grillo John
Current Estimated Value
Home Financials for this Owner
Home Financials are based on the most recent Mortgage that was taken out on this home.
Original Mortgage
$116,500
Outstanding Balance
$50,171
Interest Rate
6.15%
Mortgage Type
Seller Take Back
Estimated Equity
$202,915
Purchase Details
Closed on
Oct 10, 2000
Sold by
Hodges and Rita
Bought by
Hodges Douglas L and Hodges Rita G
Purchase Details
Closed on
Dec 8, 1998
Sold by
Skrabo John F and Skrabo Kerrie J
Bought by
Hodges Douglas and Hodges Rita
Create a Home Valuation Report for This Property
The Home Valuation Report is an in-depth analysis detailing your home's value as well as a comparison with similar homes in the area
Home Values in the Area
Average Home Value in this Area
Purchase History
| Date | Buyer | Sale Price | Title Company |
|---|---|---|---|
| Grillo John | $136,500 | Alliance Title Company | |
| Hodges Douglas L | -- | -- | |
| Hodges Douglas | $61,665 | Placer Title Company |
Source: Public Records
Mortgage History
| Date | Status | Borrower | Loan Amount |
|---|---|---|---|
| Open | Grillo John | $116,500 |
Source: Public Records
Tax History
| Year | Tax Paid | Tax Assessment Tax Assessment Total Assessment is a certain percentage of the fair market value that is determined by local assessors to be the total taxable value of land and additions on the property. | Land | Improvement |
|---|---|---|---|---|
| 2025 | $2,112 | $209,663 | $36,196 | $173,467 |
| 2024 | $2,078 | $205,553 | $35,487 | $170,066 |
| 2023 | $2,078 | $201,524 | $34,792 | $166,732 |
| 2022 | $2,041 | $197,573 | $34,110 | $163,463 |
| 2021 | $2,030 | $193,700 | $33,442 | $160,258 |
| 2020 | $2,056 | $191,715 | $33,100 | $158,615 |
| 2019 | $1,760 | $170,000 | $30,000 | $140,000 |
| 2018 | $1,429 | $135,000 | $30,000 | $105,000 |
| 2017 | $1,355 | $126,500 | $25,000 | $101,500 |
| 2016 | $1,212 | $115,000 | $25,000 | $90,000 |
| 2015 | $1,105 | $105,000 | $25,000 | $80,000 |
| 2014 | $1,019 | $96,000 | $30,000 | $66,000 |
Source: Public Records
Map
Nearby Homes
- 1129 Magnolia Ave
- 1170 Orange Ave
- 1377 Willis St
- 1010 California St
- 2351 Eureka Way
- 2315 Butte St
- 2327 Butte St
- 2036 Placer St
- 2565 North St
- 1545 Olive Ave
- 1777 Magnolia Ave
- 0 California St Unit 25-5331
- 3024 West St
- 2381/2401 West St
- 2330 West St
- 1868 Gold St
- 1723 Del Mar Ave
- 1830 Del Mar Ave
- 1833 Del Mar Ave
- 416 Arbor Place
Your Personal Tour Guide
Ask me questions while you tour the home.