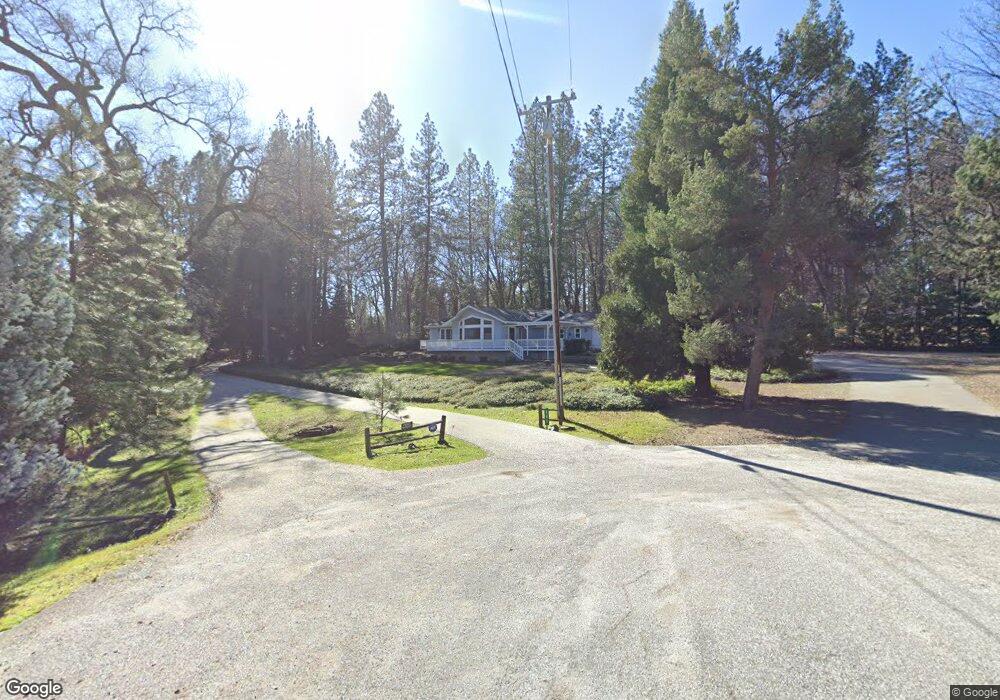
10698 W View Way Grass Valley, CA 95949
Estimated Value: $492,000 - $618,000
2
Beds
2
Baths
2,117
Sq Ft
$265/Sq Ft
Est. Value
About This Home
This home is located at 10698 W View Way, Grass Valley, CA 95949 and is currently estimated at $560,390, approximately $264 per square foot. 10698 W View Way is a home located in Nevada County with nearby schools including Alta Sierra Elementary School, Magnolia Intermediate School, and Falling Star School.
Ownership History
Date
Name
Owned For
Owner Type
Purchase Details
Closed on
Oct 2, 2007
Sold by
Suttman Patricia J
Bought by
Suttman Patricia J and Suttman Revocable L Patricia J
Current Estimated Value
Purchase Details
Closed on
Sep 24, 2001
Sold by
Deleon Patricia J
Bought by
Deleon Patricia J and The Patricia J Deleon Trust
Purchase Details
Closed on
May 5, 2001
Sold by
Pietrantonio Joseph R and Pietrantonio Marjorie A
Bought by
Deleon Patricia J
Home Financials for this Owner
Home Financials are based on the most recent Mortgage that was taken out on this home.
Original Mortgage
$210,000
Outstanding Balance
$78,588
Interest Rate
7.06%
Estimated Equity
$481,802
Purchase Details
Closed on
Mar 15, 2000
Sold by
Pietrantonio Joseph and Pietrantonio Marjorie
Bought by
Pietrantonio Joseph R and Pietrantonio Marjorie A
Create a Home Valuation Report for This Property
The Home Valuation Report is an in-depth analysis detailing your home's value as well as a comparison with similar homes in the area
Home Values in the Area
Average Home Value in this Area
Purchase History
| Date | Buyer | Sale Price | Title Company |
|---|---|---|---|
| Suttman Patricia J | -- | None Available | |
| Suttman Patricia J | -- | None Available | |
| Deleon Patricia J | -- | -- | |
| Deleon Patricia J | $280,000 | First American Title Ins Co | |
| Pietrantonio Joseph R | -- | -- |
Source: Public Records
Mortgage History
| Date | Status | Borrower | Loan Amount |
|---|---|---|---|
| Open | Deleon Patricia J | $210,000 |
Source: Public Records
Tax History Compared to Growth
Tax History
| Year | Tax Paid | Tax Assessment Tax Assessment Total Assessment is a certain percentage of the fair market value that is determined by local assessors to be the total taxable value of land and additions on the property. | Land | Improvement |
|---|---|---|---|---|
| 2025 | $5,322 | $501,540 | $109,233 | $392,307 |
| 2024 | $5,216 | $491,707 | $107,092 | $384,615 |
| 2023 | $5,216 | $482,067 | $104,993 | $377,074 |
| 2022 | $5,108 | $472,616 | $102,935 | $369,681 |
| 2021 | $4,973 | $463,350 | $100,917 | $362,433 |
| 2020 | $4,960 | $458,600 | $99,883 | $358,717 |
| 2019 | $4,858 | $449,609 | $97,925 | $351,684 |
| 2018 | $4,761 | $440,794 | $96,005 | $344,789 |
| 2017 | $4,668 | $432,152 | $94,123 | $338,029 |
| 2016 | $4,497 | $423,680 | $92,278 | $331,402 |
| 2015 | $4,431 | $417,317 | $90,892 | $326,425 |
| 2014 | $4,431 | $409,143 | $89,112 | $320,031 |
Source: Public Records
Map
Nearby Homes
- 10352 Mountain Lion Ln
- 11277 Alta Sierra Dr
- 10971 Juanita Ct
- 16465 Norlene Way
- 10514 Alta Sierra Dr
- 11818 Upper Circle Dr
- 11173 Edward Dr
- 11227 Edward Dr
- 10061 Alta Sierra Dr
- 16883 Scott Way
- 16939 Norlene Way
- 11131 Ragan Way
- 15752 State Highway 49
- 11425 Lower Circle Dr
- 15386 Little Valley Rd
- 17076 Norlene Way
- 17059 Alioto Dr
- 16929 Lawrence Way
- 17477 Lawrence Way
- 11575 Bernadine Ct
- 10710 Westview Way
- 10709 W View Way
- 10710 W View Way
- 10736 W View Way
- 16004 Norlene Way
- 10737 W View Way
- 16067 Langley Place
- 15932 Tippy Way
- 15947 Thiel Way
- 15910 Tippy Way
- 16068 Norlene Way
- 15935 Thiel Way
- 16103 Langley Place
- 15925 Thiel Way
- 16009 Norlene Way
- 16141 Langley Place
- 15909 Thiel Way
- 16004 Langley Place
- 15934 Thiel Way