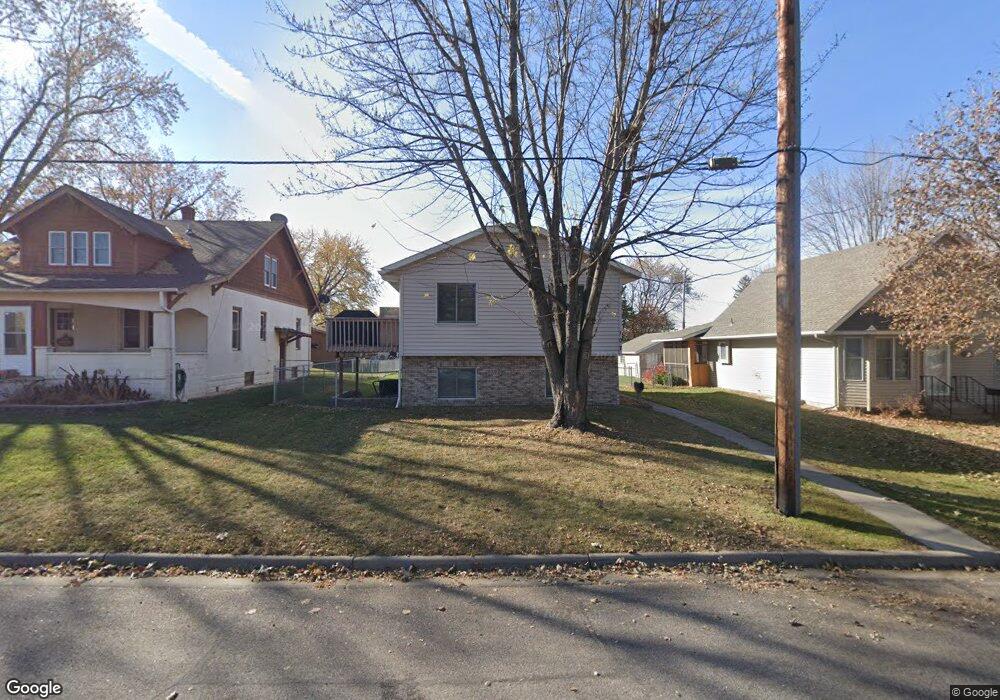
107 5th Ave N Sauk Rapids, MN 56379
Estimated Value: $239,000 - $261,000
4
Beds
2
Baths
912
Sq Ft
$273/Sq Ft
Est. Value
About This Home
This home is located at 107 5th Ave N, Sauk Rapids, MN 56379 and is currently estimated at $249,320, approximately $273 per square foot. 107 5th Ave N is a home located in Benton County with nearby schools including Mississippi Heights Elementary School, Sauk Rapids-Rice Middle School, and Sauk Rapids-Rice Senior High School.
Ownership History
Date
Name
Owned For
Owner Type
Purchase Details
Closed on
Aug 14, 2017
Sold by
Baker Laura J and Baker Ryan P
Bought by
Ludwig Laura W and Ludwig Michael
Current Estimated Value
Purchase Details
Closed on
Jul 18, 2011
Sold by
Holzem Jane K and Holzem Michael
Bought by
Baker Ryan P and Baker Laura J
Home Financials for this Owner
Home Financials are based on the most recent Mortgage that was taken out on this home.
Original Mortgage
$128,040
Interest Rate
4.52%
Mortgage Type
New Conventional
Create a Home Valuation Report for This Property
The Home Valuation Report is an in-depth analysis detailing your home's value as well as a comparison with similar homes in the area
Home Values in the Area
Average Home Value in this Area
Purchase History
| Date | Buyer | Sale Price | Title Company |
|---|---|---|---|
| Ludwig Laura W | -- | None Available | |
| Baker Ryan P | $132,000 | -- |
Source: Public Records
Mortgage History
| Date | Status | Borrower | Loan Amount |
|---|---|---|---|
| Previous Owner | Baker Ryan P | $128,040 |
Source: Public Records
Tax History Compared to Growth
Tax History
| Year | Tax Paid | Tax Assessment Tax Assessment Total Assessment is a certain percentage of the fair market value that is determined by local assessors to be the total taxable value of land and additions on the property. | Land | Improvement |
|---|---|---|---|---|
| 2025 | $2,854 | $232,600 | $25,000 | $207,600 |
| 2024 | $2,670 | $220,600 | $25,000 | $195,600 |
| 2023 | $2,588 | $218,500 | $25,000 | $193,500 |
| 2022 | $2,472 | $192,300 | $22,800 | $169,500 |
| 2021 | $2,278 | $165,800 | $22,800 | $143,000 |
| 2018 | $1,718 | $139,100 | $21,900 | $117,200 |
| 2017 | $1,718 | $106,300 | $17,676 | $88,624 |
| 2016 | $1,684 | $126,000 | $21,900 | $104,100 |
| 2015 | $1,680 | $91,500 | $16,967 | $74,533 |
| 2014 | -- | $86,100 | $16,657 | $69,443 |
| 2013 | -- | $87,500 | $16,750 | $70,750 |
Source: Public Records
Map
Nearby Homes
- 117 6th Ave N
- 216 8th Ave N
- 112 Summit Ave S
- 615 3rd Ave N
- 100 9th Ave S
- 224 9th St N
- 1101 10th Ave N
- 1107 10th Ave N
- 608 Summit Ave S
- 1105 Summit Ave N
- 2021 Hillcrest Dr
- 3300 321st St
- 3322 321st St
- 752 12th St N
- 314 Pleasant Ridge Dr
- 2161 Mill Pond Dr
- 1201 10th Ave N
- 32467 County Road 1
- 1018 N Benton Dr
- 1804 8th Ave S