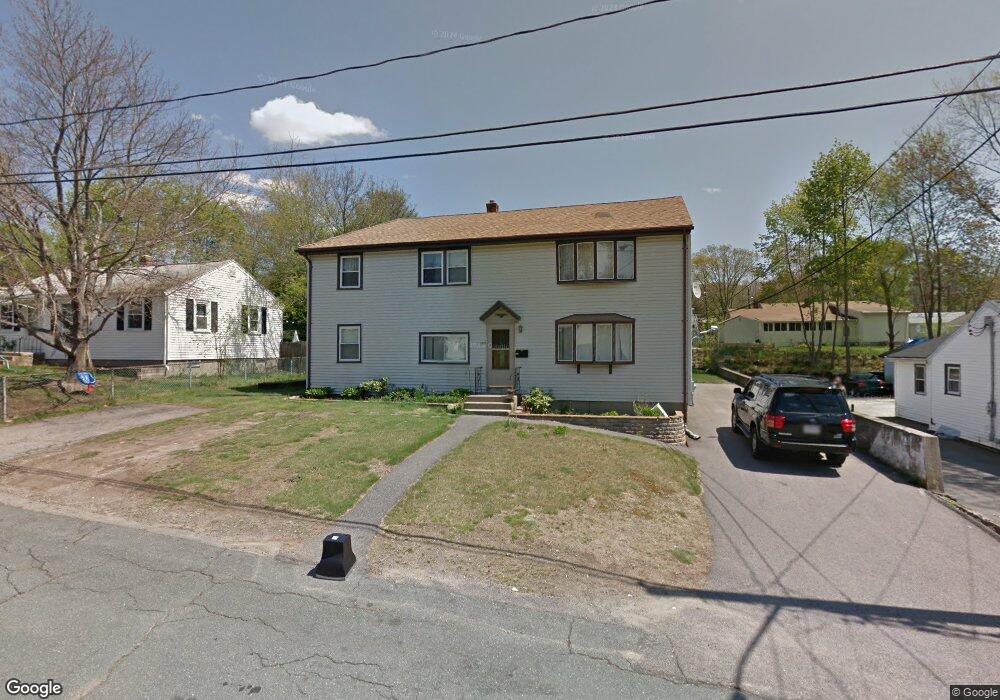
107 Algonquin St Brockton, MA 02302
Estimated Value: $581,689 - $727,000
8
Beds
2
Baths
2,412
Sq Ft
$276/Sq Ft
Est. Value
About This Home
This home is located at 107 Algonquin St, Brockton, MA 02302 and is currently estimated at $665,172, approximately $275 per square foot. 107 Algonquin St is a home located in Plymouth County with nearby schools including Brookfield Elementary School, Mary E. Baker Elementary School, and Downey Elementary School.
Ownership History
Date
Name
Owned For
Owner Type
Purchase Details
Closed on
Dec 30, 2004
Sold by
Quirke Sherri A and Quirke Timothy
Bought by
Spinola Maria A
Current Estimated Value
Home Financials for this Owner
Home Financials are based on the most recent Mortgage that was taken out on this home.
Original Mortgage
$244,000
Interest Rate
5.73%
Mortgage Type
Purchase Money Mortgage
Purchase Details
Closed on
Jul 27, 2001
Sold by
Mahoney Ret
Bought by
Quirke Sherri A
Purchase Details
Closed on
Jun 27, 1988
Sold by
Anderson Linda M
Bought by
Mahoney Bernard
Create a Home Valuation Report for This Property
The Home Valuation Report is an in-depth analysis detailing your home's value as well as a comparison with similar homes in the area
Purchase History
| Date | Buyer | Sale Price | Title Company |
|---|---|---|---|
| Spinola Maria A | $308,000 | -- | |
| Quirke Sherri A | $203,000 | -- | |
| Mahoney Bernard | $158,000 | -- |
Source: Public Records
Mortgage History
| Date | Status | Borrower | Loan Amount |
|---|---|---|---|
| Open | Mahoney Bernard | $222,000 | |
| Closed | Mahoney Bernard | $244,000 | |
| Closed | Mahoney Bernard | $10,000 | |
| Previous Owner | Mahoney Bernard | $200,000 |
Source: Public Records
Tax History
| Year | Tax Paid | Tax Assessment Tax Assessment Total Assessment is a certain percentage of the fair market value that is determined by local assessors to be the total taxable value of land and additions on the property. | Land | Improvement |
|---|---|---|---|---|
| 2025 | $6,553 | $541,100 | $144,000 | $397,100 |
| 2024 | $6,217 | $517,200 | $144,000 | $373,200 |
| 2023 | $5,576 | $429,600 | $108,700 | $320,900 |
| 2022 | $5,457 | $390,600 | $98,700 | $291,900 |
| 2021 | $5,293 | $365,000 | $91,200 | $273,800 |
| 2020 | $5,139 | $339,200 | $87,600 | $251,600 |
| 2019 | $4,803 | $309,100 | $81,000 | $228,100 |
| 2018 | $4,415 | $274,900 | $81,000 | $193,900 |
| 2017 | $4,428 | $275,000 | $81,000 | $194,000 |
| 2016 | $4,158 | $239,500 | $77,200 | $162,300 |
| 2015 | $4,185 | $230,600 | $77,200 | $153,400 |
| 2014 | $4,032 | $222,400 | $77,200 | $145,200 |
Source: Public Records
Map
Nearby Homes
- 115 Algonquin St
- 101 Algonquin St
- 28 Bradley Ave
- 34 Bradley Ave
- 22 Bradley Ave
- 97 Algonquin St
- 108 Algonquin St
- 121 Algonquin St
- 221 Anawan St
- 114 Algonquin St
- 102 Algonquin St
- 16 Bradley Ave
- 42 Bradley Ave
- 122 Algonquin St
- 91 Algonquin St
- 98 Algonquin St
- 12 Bradley Ave
- 199 Anawan St
- 92 Algonquin St
- 115 Drew Ave
Your Personal Tour Guide
Ask me questions while you tour the home.