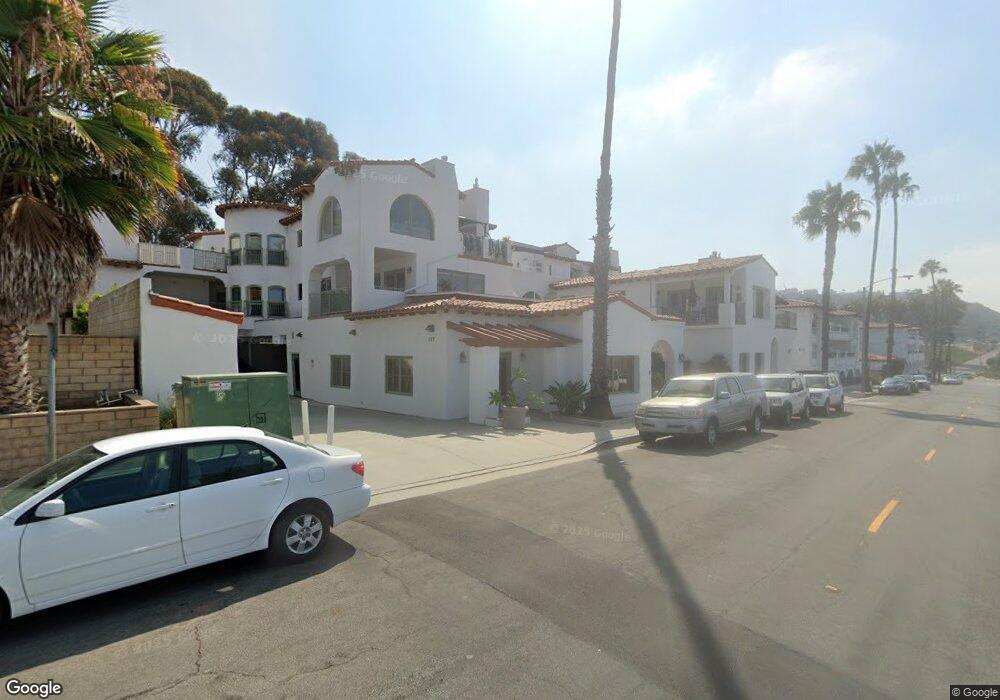
107 Avenida de la Estrella Unit D200 San Clemente, CA 92672
Central San Clemente NeighborhoodEstimated Value: $12,527,827
--
Bed
3
Baths
--
Sq Ft
0.35
Acres
About This Home
This home is located at 107 Avenida de la Estrella Unit D200, San Clemente, CA 92672 and is currently estimated at $12,527,827. 107 Avenida de la Estrella Unit D200 is a home located in Orange County with nearby schools including Clarence Lobo Elementary School, Shorecliffs Middle School, and San Clemente High School.
Ownership History
Date
Name
Owned For
Owner Type
Purchase Details
Closed on
Feb 7, 2012
Sold by
Mcalister Investments Inc
Bought by
Xingde Investment Llc
Current Estimated Value
Purchase Details
Closed on
Dec 17, 2008
Sold by
Hoferer Construction & Investments Inc
Bought by
Mcalister Investments Inc
Purchase Details
Closed on
Dec 14, 2007
Sold by
Hoferer Construction Inc
Bought by
Vista Azul Llc
Home Financials for this Owner
Home Financials are based on the most recent Mortgage that was taken out on this home.
Original Mortgage
$6,950,000
Interest Rate
6.26%
Mortgage Type
Seller Take Back
Purchase Details
Closed on
Mar 8, 2004
Sold by
Pratt David S
Bought by
Plaza Estrella Del Mar Llc
Create a Home Valuation Report for This Property
The Home Valuation Report is an in-depth analysis detailing your home's value as well as a comparison with similar homes in the area
Home Values in the Area
Average Home Value in this Area
Purchase History
| Date | Buyer | Sale Price | Title Company |
|---|---|---|---|
| Xingde Investment Llc | $4,385,000 | Ort | |
| Mcalister Investments Inc | $8,050,000 | Accommodation | |
| Vista Azul Llc | -- | None Available | |
| Plaza Estrella Del Mar Llc | -- | -- |
Source: Public Records
Mortgage History
| Date | Status | Borrower | Loan Amount |
|---|---|---|---|
| Previous Owner | Vista Azul Llc | $6,950,000 |
Source: Public Records
Tax History Compared to Growth
Tax History
| Year | Tax Paid | Tax Assessment Tax Assessment Total Assessment is a certain percentage of the fair market value that is determined by local assessors to be the total taxable value of land and additions on the property. | Land | Improvement |
|---|---|---|---|---|
| 2025 | $61,057 | $6,154,674 | $1,884,085 | $4,270,589 |
| 2024 | $61,057 | $6,033,995 | $1,847,143 | $4,186,852 |
| 2023 | $59,763 | $5,915,682 | $1,810,925 | $4,104,757 |
| 2022 | $58,625 | $5,799,689 | $1,775,417 | $4,024,272 |
| 2021 | $57,496 | $5,685,970 | $1,740,605 | $3,945,365 |
| 2020 | $56,923 | $5,627,668 | $1,722,757 | $3,904,911 |
| 2019 | $55,801 | $5,517,322 | $1,688,977 | $3,828,345 |
| 2018 | $54,730 | $5,409,140 | $1,655,860 | $3,753,280 |
| 2017 | $53,664 | $5,303,079 | $1,623,392 | $3,679,687 |
| 2016 | $52,631 | $5,199,098 | $1,591,561 | $3,607,537 |
| 2015 | $51,841 | $5,121,003 | $1,567,654 | $3,553,349 |
| 2014 | $50,853 | $5,020,690 | $1,536,946 | $3,483,744 |
Source: Public Records
Map
Nearby Homes
- 0 El Levante Unit OC24173816
- 0 El Levante Unit OC24171772
- 126 N La Esperanza
- 143 N La Esperanza
- 147 Avenida Rosa
- 124 Avenida Miramar
- 13 Vista Del Ponto Unit 72
- 28 Vista Encanta Unit 28
- 170 Avenida Presidio
- 235 S La Esperanza
- 102 Trafalgar Ln
- 100 Calle Patricia Unit 1A
- 121 Loma Ln
- 221 Avenida Monterey
- 151 Avenida Caballeros
- 227 Avenida Serra
- 229 Avenida Monterey Unit B
- 229 Avenida Monterey Unit A
- 149 Avenida de la Paz
- 152 El Levante
- 107 Avenida de la Estrella Unit A
- 107 Avenida de la Estrella
- 107 Avenida de la Estrella Unit C102
- 107 Avenida de la Estrella Unit C101
- 107 Avenida de la Estrella Unit C101, C102
- 107 Avenida de la Estrella Unit D
- 107 Avenida de la Estrella Unit C
- 107 Avenida de la Estrella Unit B
- 105 Avenida de la Estrella
- 105 Avenida de la Estrella Unit C
- 105 Avenida de la Estrella Unit 3
- 105 Avenida de la Estrella Unit 2
- 105 Avenida de la Estrella Unit 1
- 105 Avenida de la Estrella Unit 4
- 109 S El Camino Real
- 115 S El Camino Real Unit 119
- 101 S El Camino Real
- 101 S El Camino Real Unit 207
- 0 El Levante Unit CROC24171772
- 0 El Levante Unit CROC24173816