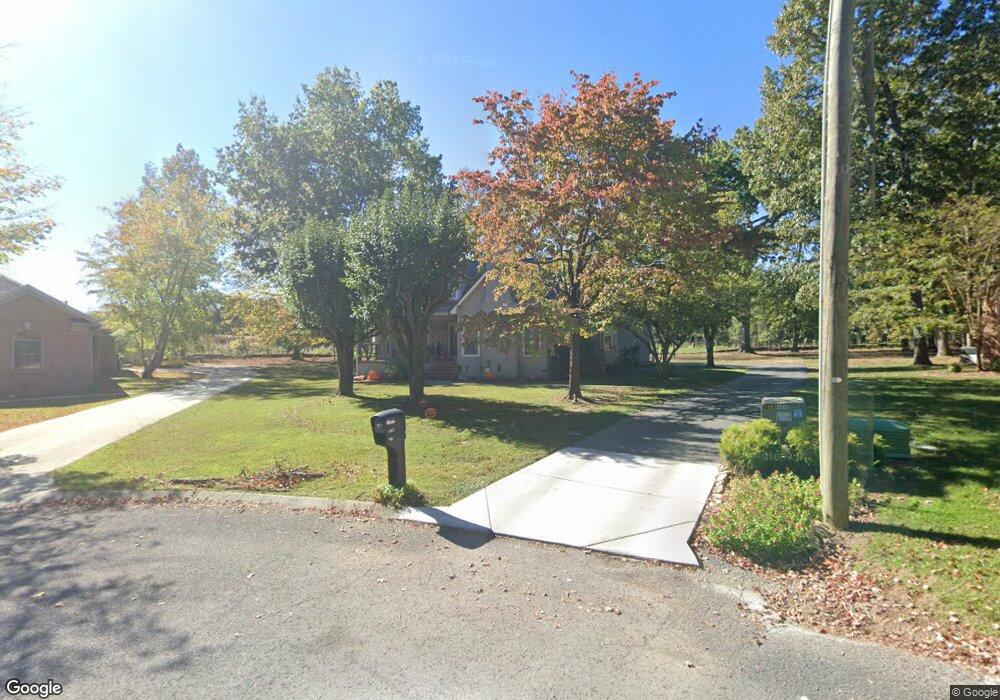
107 Blanton Ct Tullahoma, TN 37388
Estimated Value: $382,000 - $490,000
4
Beds
3
Baths
2,778
Sq Ft
$160/Sq Ft
Est. Value
About This Home
This home is located at 107 Blanton Ct, Tullahoma, TN 37388 and is currently estimated at $443,713, approximately $159 per square foot. 107 Blanton Ct is a home located in Coffee County with nearby schools including Tullahoma High School, Tullahoma Christian Academy, and Highland Rim Christian Academy.
Ownership History
Date
Name
Owned For
Owner Type
Purchase Details
Closed on
Mar 27, 2014
Sold by
Davis Sheila
Bought by
Elser Jason W and Elser Brandy S
Current Estimated Value
Home Financials for this Owner
Home Financials are based on the most recent Mortgage that was taken out on this home.
Original Mortgage
$164,767
Outstanding Balance
$125,536
Interest Rate
4.4%
Mortgage Type
VA
Estimated Equity
$318,177
Purchase Details
Closed on
Jul 12, 2013
Sold by
Davis Sheila
Bought by
Havens Mary Beth and O Davis Norman A C
Purchase Details
Closed on
Jun 10, 2013
Sold by
Davis Norman A
Bought by
Davis Sheila
Purchase Details
Closed on
Aug 9, 1995
Sold by
Bobo Jack C
Bought by
Davis Norman and Davis Mary
Purchase Details
Closed on
Jun 19, 1991
Bought by
Bobo Jack C Evelyn G
Purchase Details
Closed on
Dec 28, 1990
Bought by
First National Bank
Create a Home Valuation Report for This Property
The Home Valuation Report is an in-depth analysis detailing your home's value as well as a comparison with similar homes in the area
Home Values in the Area
Average Home Value in this Area
Purchase History
| Date | Buyer | Sale Price | Title Company |
|---|---|---|---|
| Elser Jason W | $161,300 | -- | |
| Havens Mary Beth | -- | -- | |
| Davis Sheila | -- | -- | |
| Davis Norman | $125,000 | -- | |
| Bobo Jack C Evelyn G | $115,000 | -- | |
| First National Bank | $104,800 | -- |
Source: Public Records
Mortgage History
| Date | Status | Borrower | Loan Amount |
|---|---|---|---|
| Open | Elser Jason W | $164,767 |
Source: Public Records
Tax History Compared to Growth
Tax History
| Year | Tax Paid | Tax Assessment Tax Assessment Total Assessment is a certain percentage of the fair market value that is determined by local assessors to be the total taxable value of land and additions on the property. | Land | Improvement |
|---|---|---|---|---|
| 2024 | $2,600 | $66,550 | $6,750 | $59,800 |
| 2023 | $2,600 | $66,550 | $0 | $0 |
| 2022 | $2,668 | $66,550 | $6,750 | $59,800 |
| 2021 | $2,540 | $50,675 | $5,500 | $45,175 |
| 2020 | $2,540 | $50,675 | $5,500 | $45,175 |
| 2019 | $2,540 | $50,675 | $5,500 | $45,175 |
| 2018 | $2,540 | $50,675 | $5,500 | $45,175 |
| 2017 | $2,417 | $44,200 | $5,500 | $38,700 |
| 2016 | $2,418 | $44,200 | $5,500 | $38,700 |
| 2015 | $2,418 | $44,200 | $5,500 | $38,700 |
| 2014 | $2,418 | $44,209 | $0 | $0 |
Source: Public Records
Map
Nearby Homes
- 114 Blantonwood Dr
- 309 New Kent Ct
- 302 Albemarle Dr
- 113 Sagewood Dr
- 2282 Elevation GHI Plan at Sagewood
- 1335 Elevation GHI Plan at Sagewood
- 1989 Elevation GHI Plan at Sagewood
- 1441 Elevation GHI Plan at Sagewood
- 1726 Elevation GHI Plan at Sagewood
- 1705 Elevation GHI Plan at Sagewood
- 2540 Elevation GHI Plan at Sagewood
- 1610 Elevation GHI Plan at Sagewood
- 1624 Elevation GHI Plan at Sagewood
- 2151 Elevation GHI Plan at Sagewood
- 110 Sagewood Dr
- 108 Sagewood Dr
- 115 Sagewood Dr
- 203 Huntington Place
- 306 Amherst Dr
- 104 Breckenridge Rd
- 106 Blanton Ct
- 105 Blanton Ct
- 104 Blanton Ct
- 103 Blanton Ct
- 102 Blanton Ct
- 200 Blantonwood Dr
- 202 Blantonwood Dr
- 116 Blantonwood Dr
- 204 Blantonwood Dr
- 209 Alamance Ct
- 215 Albemarle Dr
- 112 Blantonwood Dr
- 305 New Kent Ct
- 203 Blantonwood Dr
- 205 Blantonwood Dr
- 301 Albemarle Dr
- 206 Blantonwood Dr
- 201 Blantonwood Dr
- 207 Blantonwood Dr
- 115 Blantonwood Dr