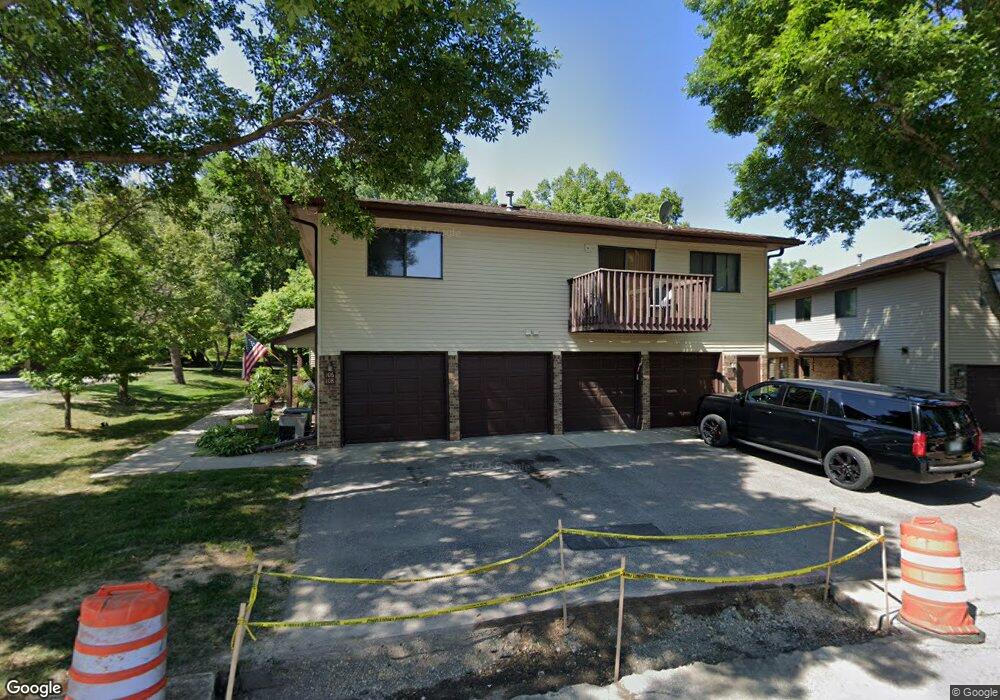
107 Conner Cir SW Unit 2 Rochester, MN 55902
Estimated Value: $218,000 - $273,000
2
Beds
2
Baths
1,004
Sq Ft
$243/Sq Ft
Est. Value
About This Home
This home is located at 107 Conner Cir SW Unit 2, Rochester, MN 55902 and is currently estimated at $244,081, approximately $243 per square foot. 107 Conner Cir SW Unit 2 is a home located in Olmsted County with nearby schools including Bamber Valley Elementary School, John Adams Middle School, and Mayo Senior High School.
Ownership History
Date
Name
Owned For
Owner Type
Purchase Details
Closed on
Mar 2, 2017
Sold by
Butzer Carl and Butzer Barbara C
Bought by
Zhang Ge
Current Estimated Value
Home Financials for this Owner
Home Financials are based on the most recent Mortgage that was taken out on this home.
Original Mortgage
$121,600
Outstanding Balance
$100,837
Interest Rate
4.17%
Mortgage Type
New Conventional
Estimated Equity
$143,244
Purchase Details
Closed on
Oct 31, 2014
Sold by
Hesley Trevor and Hesley Jill L
Bought by
Butzer Carl
Purchase Details
Closed on
Jul 2, 2007
Sold by
Gowan Kori M
Bought by
Birdseye Cathy D
Home Financials for this Owner
Home Financials are based on the most recent Mortgage that was taken out on this home.
Original Mortgage
$83,500
Interest Rate
5%
Mortgage Type
New Conventional
Create a Home Valuation Report for This Property
The Home Valuation Report is an in-depth analysis detailing your home's value as well as a comparison with similar homes in the area
Home Values in the Area
Average Home Value in this Area
Purchase History
| Date | Buyer | Sale Price | Title Company |
|---|---|---|---|
| Zhang Ge | $164,900 | Rochester Title | |
| Butzer Carl | $104,000 | Burnet Title | |
| Birdseye Cathy D | $107,500 | None Available |
Source: Public Records
Mortgage History
| Date | Status | Borrower | Loan Amount |
|---|---|---|---|
| Open | Zhang Ge | $121,600 | |
| Previous Owner | Birdseye Cathy D | $83,500 |
Source: Public Records
Tax History Compared to Growth
Tax History
| Year | Tax Paid | Tax Assessment Tax Assessment Total Assessment is a certain percentage of the fair market value that is determined by local assessors to be the total taxable value of land and additions on the property. | Land | Improvement |
|---|---|---|---|---|
| 2024 | $2,982 | $210,900 | $35,000 | $175,900 |
| 2023 | $2,450 | $194,500 | $20,000 | $174,500 |
| 2022 | $1,796 | $176,800 | $20,000 | $156,800 |
| 2021 | $1,662 | $130,600 | $20,000 | $110,600 |
| 2020 | $1,684 | $120,600 | $20,000 | $100,600 |
| 2019 | $1,634 | $117,200 | $20,000 | $97,200 |
| 2018 | $1,375 | $114,300 | $20,000 | $94,300 |
| 2017 | $1,330 | $98,700 | $15,800 | $82,900 |
| 2016 | $1,378 | $91,200 | $15,800 | $75,400 |
| 2015 | $944 | $92,400 | $15,800 | $76,600 |
| 2014 | $896 | $64,400 | $10,900 | $53,500 |
| 2012 | -- | $62,900 | $10,814 | $52,086 |
Source: Public Records
Map
Nearby Homes
- 360 Wimbledon Hills Dr SW
- 3304 Lake St NW
- 188 37th Ave NW
- 2472 Gates Dr SW
- 822 Fox Pointe Ln SW
- 3415 Lake St NW
- 700 Panorama Cir NW
- 2773 Clover Place SW
- 3324 Fox Hollow Ln SW
- 327 20th Ave SW
- 1912 3rd St SW
- 468 Panorama Cir NW
- 4119 Manor View Dr NW
- 2005 Hill Place SW
- 785 Brandon Ln SW
- 121 18th Ave NW
- 3586 6th St NW
- 1729 W Center St
- 650 36th Ave NW
- 660 36th Ave NW
- 107 Conner Cir SW
- 107 Conner Cir SW Unit 2
- 106 Conner Cir SW
- 108 Conner Cir SW
- 105 Conner Cir SW
- 102 Conner Cir SW
- 102 Conner Cir SW
- 104 104 Conner Cir SW
- 101 Conner Cir SW
- 101 Conner Cir SW
- 104 Conner Cir SW
- 104 Conner Cir SW
- 104 Conner Cir SW Unit D-1
- 103 Conner Cir SW
- 109 Conner Cir SW
- 109 Conner Cir SW
- 111 Conner Cir SW
- 110 Conner Cir SW
- 110 Conner Cir SW
- 110 Conner Cir SW