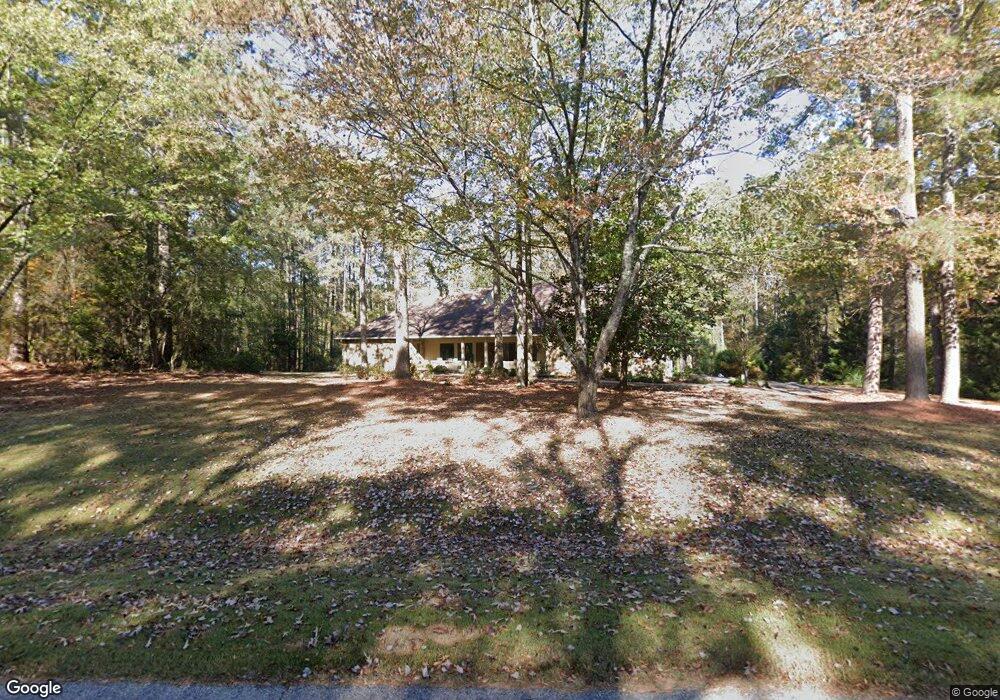
107 Deal Dr Lagrange, GA 30240
Estimated Value: $519,000 - $777,000
3
Beds
4
Baths
3,030
Sq Ft
$205/Sq Ft
Est. Value
About This Home
This home is located at 107 Deal Dr, Lagrange, GA 30240 and is currently estimated at $621,682, approximately $205 per square foot. 107 Deal Dr is a home located in Troup County with nearby schools including Hollis Hand Elementary School, Ethel W. Kight Elementary School, and Franklin Forest Elementary School.
Ownership History
Date
Name
Owned For
Owner Type
Purchase Details
Closed on
Jan 10, 2025
Sold by
Gresham James T
Bought by
Gresham James T and Gresham Kim M
Current Estimated Value
Home Financials for this Owner
Home Financials are based on the most recent Mortgage that was taken out on this home.
Original Mortgage
$500,000
Outstanding Balance
$278,986
Interest Rate
6.6%
Mortgage Type
New Conventional
Estimated Equity
$342,696
Purchase Details
Closed on
Nov 25, 1992
Sold by
Jafnandon
Bought by
Gresham James T
Purchase Details
Closed on
May 13, 1991
Sold by
Korth Mary C
Bought by
Jafnandon
Purchase Details
Closed on
Jul 15, 1980
Sold by
Digirolamo
Bought by
Korth Mary C
Purchase Details
Closed on
Jan 20, 1977
Sold by
Daniel Lumber Co
Bought by
Digirolamo
Purchase Details
Closed on
Jan 1, 1975
Bought by
Daniel Lumber Co
Create a Home Valuation Report for This Property
The Home Valuation Report is an in-depth analysis detailing your home's value as well as a comparison with similar homes in the area
Purchase History
| Date | Buyer | Sale Price | Title Company |
|---|---|---|---|
| Gresham James T | $500,000 | -- | |
| Gresham James T | -- | -- | |
| Jafnandon | $250,000 | -- | |
| Korth Mary C | -- | -- | |
| Digirolamo | -- | -- | |
| Daniel Lumber Co | -- | -- |
Source: Public Records
Mortgage History
| Date | Status | Borrower | Loan Amount |
|---|---|---|---|
| Open | Gresham James T | $500,000 |
Source: Public Records
Tax History
| Year | Tax Paid | Tax Assessment Tax Assessment Total Assessment is a certain percentage of the fair market value that is determined by local assessors to be the total taxable value of land and additions on the property. | Land | Improvement |
|---|---|---|---|---|
| 2025 | $5,628 | $215,840 | $26,000 | $189,840 |
| 2024 | $5,257 | $194,760 | $26,000 | $168,760 |
| 2023 | $4,825 | $178,920 | $20,000 | $158,920 |
| 2022 | $4,678 | $169,600 | $20,000 | $149,600 |
| 2021 | $4,219 | $141,880 | $25,080 | $116,800 |
| 2020 | $4,219 | $141,880 | $25,080 | $116,800 |
| 2019 | $4,703 | $157,920 | $25,080 | $132,840 |
| 2018 | $4,703 | $157,920 | $25,080 | $132,840 |
| 2017 | $4,703 | $157,920 | $25,080 | $132,840 |
| 2016 | $4,686 | $157,351 | $25,100 | $132,251 |
| 2015 | $4,686 | $157,351 | $25,100 | $132,251 |
| 2014 | $4,487 | $150,739 | $25,100 | $125,639 |
| 2013 | -- | $153,025 | $25,100 | $127,925 |
Source: Public Records
Map
Nearby Homes
- 101 Deal Dr
- 116 Deal Dr
- 638 Cameron Mill Rd
- 106 Highland Park
- 1000 Foxcroft Dr
- 960 Cameron Mill Rd
- 2005 Foxcroft Dr
- 2010 Foxcroft Dr
- 201 Willowcrest Way
- 0 Hills and Dales Farm Rd
- 104 Spring Valley Dr
- 1784 Mooty Bridge Rd
- 210 Pinehaven Dr
- 117 Brookwood Dr
- 112 Brookwood Dr
- 103 Iroquois Dr
- 110 Pond View Point
- 203 Shawnee Dr
- 420 Ridgecrest Rd
- 732 Camellia Dr
Your Personal Tour Guide
Ask me questions while you tour the home.