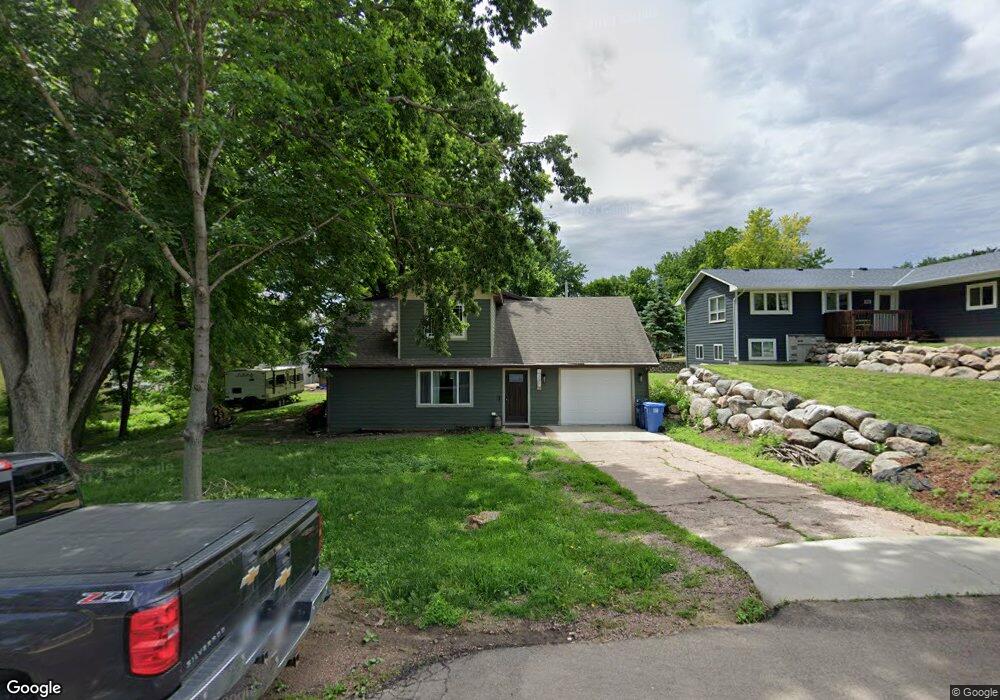
107 E 6th St Dell Rapids, SD 57022
Estimated Value: $281,000 - $345,000
4
Beds
3
Baths
2,352
Sq Ft
$135/Sq Ft
Est. Value
About This Home
This home is located at 107 E 6th St, Dell Rapids, SD 57022 and is currently estimated at $318,273, approximately $135 per square foot. 107 E 6th St is a home located in Minnehaha County with nearby schools including Dell Rapids Elementary School, Dell Rapids Middle School, and Dell Rapids High School.
Ownership History
Date
Name
Owned For
Owner Type
Purchase Details
Closed on
Sep 8, 2022
Sold by
Keogh Joseph L and Keogh Breanna
Bought by
Larson Taylor
Current Estimated Value
Home Financials for this Owner
Home Financials are based on the most recent Mortgage that was taken out on this home.
Original Mortgage
$283,765
Outstanding Balance
$274,046
Interest Rate
6.75%
Mortgage Type
FHA
Estimated Equity
$44,227
Purchase Details
Closed on
Sep 11, 2019
Sold by
Willuweit Wesley C and Willuweit Kimberly A
Bought by
Keogh Joseph L and Keogh Breanna
Home Financials for this Owner
Home Financials are based on the most recent Mortgage that was taken out on this home.
Original Mortgage
$146,163
Interest Rate
3.49%
Mortgage Type
FHA
Purchase Details
Closed on
Mar 24, 2014
Sold by
Lasalle National Bank
Bought by
Willuweit Wesley C and Willuweit Kimberly A
Create a Home Valuation Report for This Property
The Home Valuation Report is an in-depth analysis detailing your home's value as well as a comparison with similar homes in the area
Home Values in the Area
Average Home Value in this Area
Purchase History
| Date | Buyer | Sale Price | Title Company |
|---|---|---|---|
| Larson Taylor | $289,000 | -- | |
| Larson Taylor | $289,000 | -- | |
| Keogh Joseph L | $140,000 | Getty Abstract & Title Co | |
| Willuweit Wesley C | $12,000 | -- |
Source: Public Records
Mortgage History
| Date | Status | Borrower | Loan Amount |
|---|---|---|---|
| Open | Larson Taylor | $283,765 | |
| Closed | Larson Taylor | $283,765 | |
| Previous Owner | Keogh Joseph L | $146,163 |
Source: Public Records
Tax History
| Year | Tax Paid | Tax Assessment Tax Assessment Total Assessment is a certain percentage of the fair market value that is determined by local assessors to be the total taxable value of land and additions on the property. | Land | Improvement |
|---|---|---|---|---|
| 2024 | $4,490 | $332,200 | $27,700 | $304,500 |
| 2023 | $4,281 | $300,200 | $27,700 | $272,500 |
| 2022 | $1,526 | $101,200 | $27,700 | $73,500 |
| 2021 | $1,351 | $96,800 | $0 | $0 |
| 2020 | $1,351 | $84,000 | $0 | $0 |
| 2019 | $1,590 | $83,663 | $0 | $0 |
| 2018 | $1,535 | $78,493 | $0 | $0 |
| 2017 | $1,468 | $77,083 | $25,864 | $51,219 |
| 2016 | $1,468 | $71,574 | $25,864 | $45,710 |
| 2015 | $1,528 | $69,866 | $25,864 | $44,002 |
| 2014 | $1,199 | $66,448 | $25,864 | $40,584 |
Source: Public Records
Map
Nearby Homes
- 207 E 9th St
- 300 W 8th St
- 511 E 3rd St
- 0 4th St St Unit 22600917
- 1307 Clark Ave
- 407 S Orleans Ave
- 1504 Julie Cir Unit L17B2
- 1502 Julie Cir Unit L16B2
- 1500 Neil Ave Unit L1B2
- 1506 Julie Cir Unit L18B2
- 1502 Neil Ave Unit L2B2
- 1503 Neil Ave Unit L2B1
- 1501 Neil Ave Unit L1B1
- 1503 Julie Cir Unit L15B2
- 1504 Neil Ave Unit L3B2
- 0 Lt 1 Bk 8 Birdie Dr
- 1600 Julie Cir Unit L19B2
- 1609 Neil Ave Unit L9B1
- 0 Lt 3 Bk 8 Birdie Dr Dr
- 904 E 11th St
Your Personal Tour Guide
Ask me questions while you tour the home.