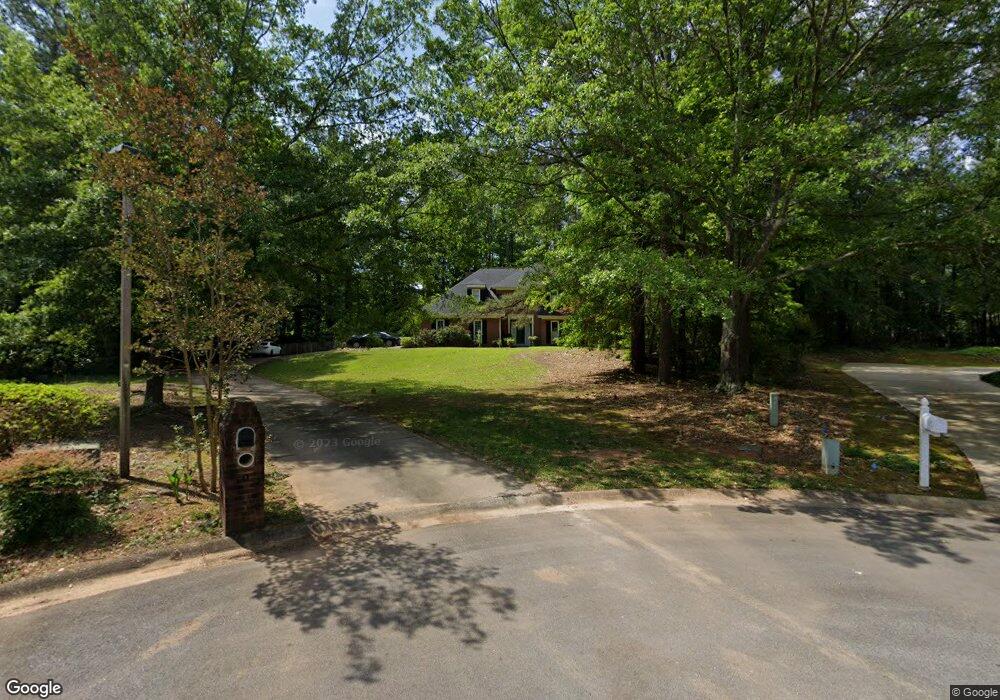
107 Edens Edge Unit 5 Peachtree City, GA 30269
Estimated Value: $465,000 - $599,000
4
Beds
3
Baths
2,458
Sq Ft
$211/Sq Ft
Est. Value
About This Home
This home is located at 107 Edens Edge Unit 5, Peachtree City, GA 30269 and is currently estimated at $518,939, approximately $211 per square foot. 107 Edens Edge Unit 5 is a home located in Fayette County with nearby schools including Peachtree City Elementary School, Booth Middle School, and McIntosh High School.
Ownership History
Date
Name
Owned For
Owner Type
Purchase Details
Closed on
Dec 18, 2019
Sold by
107 Eden Edge Llc
Bought by
Cf Kl Assets 2019 1 Llc
Current Estimated Value
Purchase Details
Closed on
Jan 26, 2016
Sold by
Wilson Mike
Bought by
107 Eden Court Llc
Purchase Details
Closed on
Feb 27, 2015
Sold by
Mullin Mark A
Bought by
Wilson Mike
Purchase Details
Closed on
Feb 18, 1998
Sold by
Bearden Richard W and Bearden Judith S
Bought by
Mullin Mark A and Chiado Beatrice L
Home Financials for this Owner
Home Financials are based on the most recent Mortgage that was taken out on this home.
Original Mortgage
$173,850
Interest Rate
6.89%
Mortgage Type
New Conventional
Purchase Details
Closed on
Jun 7, 1994
Sold by
Regency Homes
Bought by
Bearden Richard Judith
Home Financials for this Owner
Home Financials are based on the most recent Mortgage that was taken out on this home.
Original Mortgage
$123,800
Interest Rate
8.27%
Create a Home Valuation Report for This Property
The Home Valuation Report is an in-depth analysis detailing your home's value as well as a comparison with similar homes in the area
Home Values in the Area
Average Home Value in this Area
Purchase History
| Date | Buyer | Sale Price | Title Company |
|---|---|---|---|
| Cf Kl Assets 2019 1 Llc | $267,500 | -- | |
| 107 Eden Court Llc | -- | -- | |
| Wilson Mike | $283,100 | -- | |
| Mullin Mark A | $183,000 | -- | |
| Bearden Richard Judith | $157,300 | -- | |
| Regency Homes | $157,300 | -- |
Source: Public Records
Mortgage History
| Date | Status | Borrower | Loan Amount |
|---|---|---|---|
| Previous Owner | Mullin Mark A | $173,850 | |
| Previous Owner | Regency Homes | $123,800 |
Source: Public Records
Tax History Compared to Growth
Tax History
| Year | Tax Paid | Tax Assessment Tax Assessment Total Assessment is a certain percentage of the fair market value that is determined by local assessors to be the total taxable value of land and additions on the property. | Land | Improvement |
|---|---|---|---|---|
| 2024 | $5,404 | $182,840 | $29,600 | $153,240 |
| 2023 | $4,715 | $182,840 | $29,600 | $153,240 |
| 2022 | $4,707 | $182,840 | $29,600 | $153,240 |
| 2021 | $3,881 | $126,340 | $22,800 | $103,540 |
| 2020 | $3,322 | $107,000 | $17,040 | $89,960 |
| 2019 | $4,309 | $137,440 | $22,800 | $114,640 |
| 2018 | $4,147 | $130,160 | $22,800 | $107,360 |
| 2017 | $3,833 | $119,520 | $22,800 | $96,720 |
| 2016 | $3,589 | $107,800 | $22,800 | $85,000 |
| 2015 | $2,294 | $100,360 | $22,800 | $77,560 |
| 2014 | $2,209 | $94,720 | $22,800 | $71,920 |
| 2013 | -- | $91,600 | $0 | $0 |
Source: Public Records
Map
Nearby Homes
- 106 Sandtrap Ridge
- 406 Daker Dr
- 103 Greensway
- 1000 Blair Ln
- 930 Laurel Brooke Ave
- 110 Paddock Trail
- 115 Edgewater Way
- 108 Madison Ave
- 153 Lakeside Dr
- 527 Hazelnut Dr
- 221 N Cove Dr
- 12 Northlake Cir
- 20 Fairway Ln
- 330 N Peachtree Pkwy
- 319 Ruffian Cir Unit 71
- 313 Ruffian Cir Unit 74
- 317 Ruffian Cir Unit 72
- 321 Ruffian Cir Unit 70
- 445 Seabisuit Walk
- 36 Fairway Ln
- 107 Edens Edge
- 0 Edens Edge Unit 8842862
- 0 Edens Edge Unit 7299870
- 0 Edens Edge
- 105 Edens Edge
- 106 Edens Edge
- 106 Gleneagles Point
- 103 Edens Edge
- 104 Edens Edge
- 108 Gleneagles Point
- 104 Gleneagles Point
- 102 Edens Edge
- 102 Highlands Way
- 102 Gleneagles Point
- 100 Highlands Way
- 210 Waterwood Bend
- 109 Gleneagles Point
- 106 Highlands Way
- 107 Gleneagles Point
- 0 Gleneagles Point Unit 8723156