Estimated Value: $218,000 - $236,451
3
Beds
2
Baths
1,424
Sq Ft
$158/Sq Ft
Est. Value
About This Home
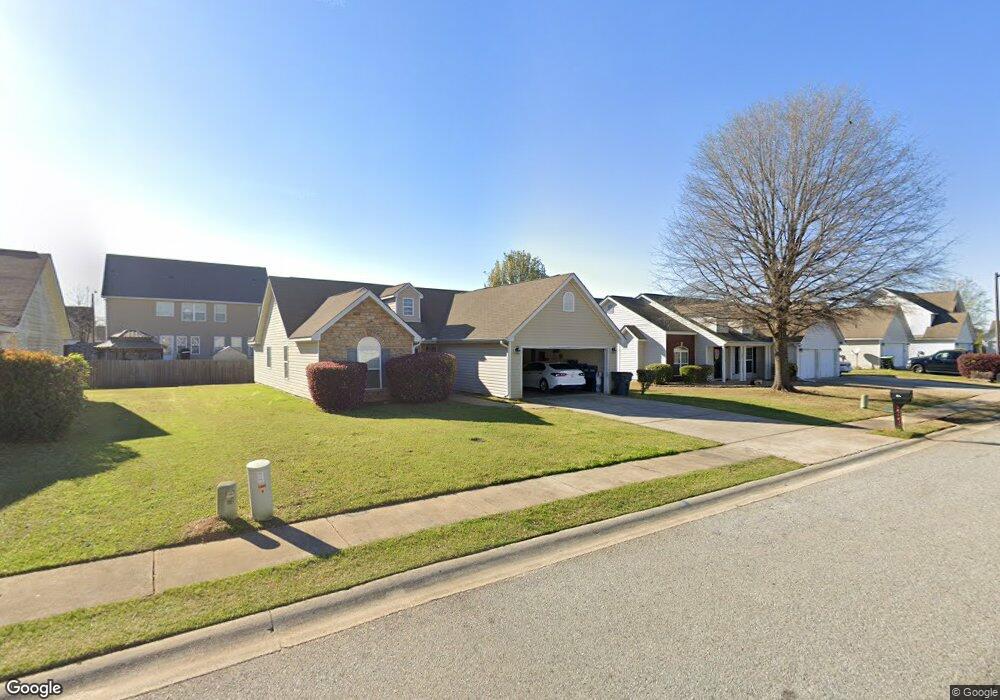
This home is located at 107 Faybrook Dr, Byron, GA 31008 and is currently estimated at $225,113, approximately $158 per square foot. 107 Faybrook Dr is a home located in Houston County with nearby schools including Eagle Springs Elementary School, Thomson Middle School, and Northside High School.
Ownership History
Date
Name
Owned For
Owner Type
Purchase Details
Closed on
Oct 17, 2022
Sold by
Arhin Benjamin A
Bought by
Arhin Benjamin A and Arhin Genevieve
Current Estimated Value
Home Financials for this Owner
Home Financials are based on the most recent Mortgage that was taken out on this home.
Original Mortgage
$144,000
Outstanding Balance
$138,551
Interest Rate
6.02%
Mortgage Type
Balloon
Estimated Equity
$86,562
Purchase Details
Closed on
Sep 28, 2005
Sold by
Branch Banking & Trust Company
Bought by
The Knight Group Inc
Purchase Details
Closed on
Oct 26, 2004
Sold by
Eagle Springs Llc
Bought by
The Knight Group Inc
Create a Home Valuation Report for This Property
The Home Valuation Report is an in-depth analysis detailing your home's value as well as a comparison with similar homes in the area
Home Values in the Area
Average Home Value in this Area
Purchase History
| Date | Buyer | Sale Price | Title Company |
|---|---|---|---|
| Arhin Benjamin A | -- | Title365 | |
| The Knight Group Inc | -- | None Available | |
| Arhin Benjamin A | $118,900 | -- | |
| The Knight Group Inc | -- | -- | |
| The Knight Group Inc | $17,500 | -- |
Source: Public Records
Mortgage History
| Date | Status | Borrower | Loan Amount |
|---|---|---|---|
| Open | Arhin Benjamin A | $144,000 |
Source: Public Records
Tax History Compared to Growth
Tax History
| Year | Tax Paid | Tax Assessment Tax Assessment Total Assessment is a certain percentage of the fair market value that is determined by local assessors to be the total taxable value of land and additions on the property. | Land | Improvement |
|---|---|---|---|---|
| 2024 | $2,484 | $75,920 | $12,000 | $63,920 |
| 2023 | $2,006 | $60,840 | $10,000 | $50,840 |
| 2022 | $1,172 | $50,960 | $8,000 | $42,960 |
| 2021 | $1,045 | $45,200 | $7,000 | $38,200 |
| 2020 | $977 | $42,040 | $7,000 | $35,040 |
| 2019 | $977 | $42,040 | $7,000 | $35,040 |
| 2018 | $977 | $42,040 | $7,000 | $35,040 |
| 2017 | $978 | $42,040 | $7,000 | $35,040 |
| 2016 | $979 | $42,040 | $7,000 | $35,040 |
| 2015 | -- | $41,640 | $7,000 | $34,640 |
| 2014 | -- | $41,640 | $7,000 | $34,640 |
| 2013 | -- | $42,800 | $7,000 | $35,800 |
Source: Public Records
Map
Nearby Homes
- 109 Faybrook Dr
- 105 Faybrook Dr
- 108 Browning Point
- 106 Browning Point
- 110 Browning Point
- 111 Faybrook Dr
- 104 Browning Point
- 103 Faybrook Dr
- 106 Faybrook Dr
- 104 Faybrook Dr
- 108 Faybrook Dr
- 112 Browning Point
- 102 Browning Point
- 113 Faybrook Dr
- 110 Faybrook Dr
- 114 Browning Point
- 100 Browning Point
- 107 Browning Point
- 109 Browning Point
- 115 Faybrook Dr