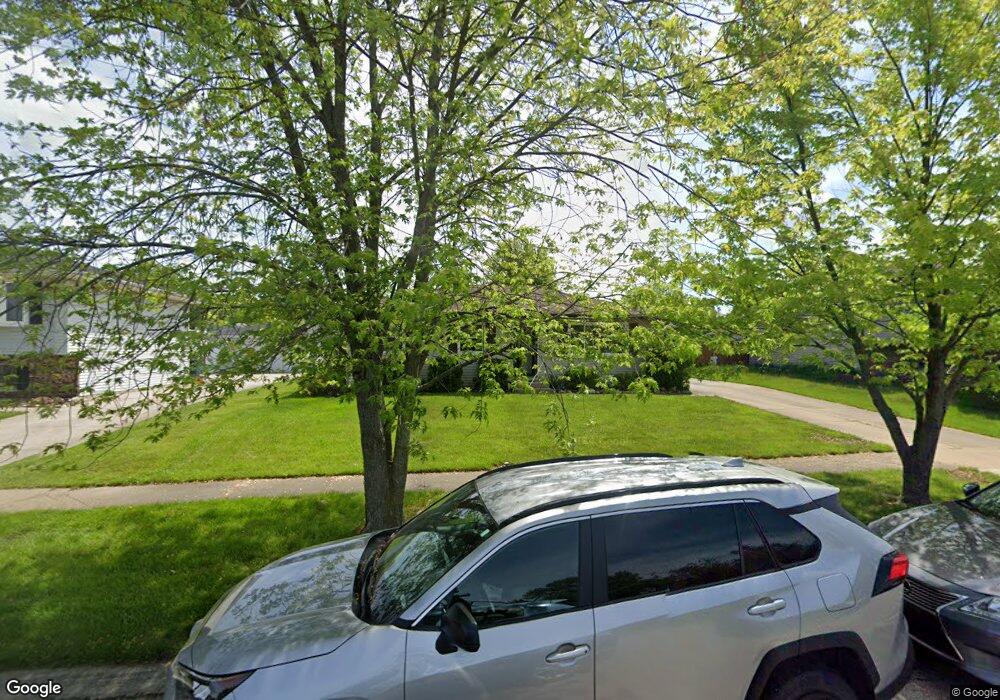
107 Fir Ct Hebron, IN 46341
Porter County NeighborhoodEstimated Value: $228,000 - $246,000
3
Beds
2
Baths
1,120
Sq Ft
$213/Sq Ft
Est. Value
About This Home
This home is located at 107 Fir Ct, Hebron, IN 46341 and is currently estimated at $238,499, approximately $212 per square foot. 107 Fir Ct is a home located in Porter County with nearby schools including Hebron Elementary School, Hebron Middle School, and Hebron High School.
Ownership History
Date
Name
Owned For
Owner Type
Purchase Details
Closed on
Sep 6, 2011
Sold by
Marshall Christopher W
Bought by
Syrovatka James F and Syrovatka Marilyn
Current Estimated Value
Home Financials for this Owner
Home Financials are based on the most recent Mortgage that was taken out on this home.
Original Mortgage
$127,687
Outstanding Balance
$88,022
Interest Rate
4.4%
Mortgage Type
VA
Estimated Equity
$150,477
Create a Home Valuation Report for This Property
The Home Valuation Report is an in-depth analysis detailing your home's value as well as a comparison with similar homes in the area
Home Values in the Area
Average Home Value in this Area
Purchase History
| Date | Buyer | Sale Price | Title Company |
|---|---|---|---|
| Syrovatka James F | -- | Community Title Company |
Source: Public Records
Mortgage History
| Date | Status | Borrower | Loan Amount |
|---|---|---|---|
| Open | Syrovatka James F | $127,687 |
Source: Public Records
Tax History Compared to Growth
Tax History
| Year | Tax Paid | Tax Assessment Tax Assessment Total Assessment is a certain percentage of the fair market value that is determined by local assessors to be the total taxable value of land and additions on the property. | Land | Improvement |
|---|---|---|---|---|
| 2024 | $2,030 | $191,800 | $29,300 | $162,500 |
| 2023 | $2,003 | $184,400 | $27,500 | $156,900 |
| 2022 | $1,903 | $175,200 | $27,500 | $147,700 |
| 2021 | $1,661 | $150,600 | $27,500 | $123,100 |
| 2020 | $1,549 | $141,400 | $25,000 | $116,400 |
| 2019 | $1,480 | $135,500 | $25,000 | $110,500 |
| 2018 | $1,450 | $130,000 | $25,000 | $105,000 |
| 2017 | $1,381 | $124,100 | $25,000 | $99,100 |
| 2016 | $1,390 | $125,500 | $24,400 | $101,100 |
| 2014 | $1,411 | $127,400 | $24,600 | $102,800 |
| 2013 | -- | $119,700 | $24,700 | $95,000 |
Source: Public Records
Map
Nearby Homes
- 114 Beech Ct
- 118 Cherry Ct
- 96 Hickory Ave
- 709 W Wilson St
- 1000 S State Road 2
- Henley Basement Plan at Park Ridge
- Sydney Basement Plan at Park Ridge
- Sienna Basement Plan at Park Ridge
- Harmony Basement Plan at Park Ridge
- Bellamy Basement Plan at Park Ridge
- 435 Fry St
- 437 Fry St
- 21 Marvin Gardens Ave
- 433 Fry St
- 431 Fry St
- 439 Fry St
- 585 Marcella St
- 444 Fry St
- 587 Marcella St
- 596 Petry St