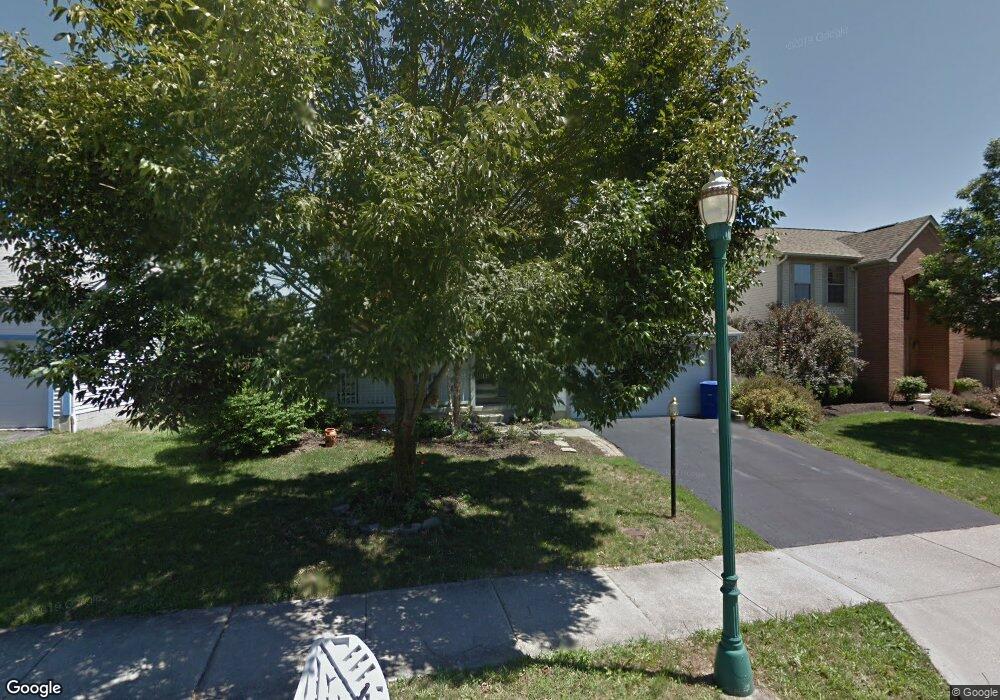
107 Miners Ct Delaware, OH 43015
Estimated Value: $344,000 - $414,000
4
Beds
3
Baths
1,924
Sq Ft
$196/Sq Ft
Est. Value
About This Home
This home is located at 107 Miners Ct, Delaware, OH 43015 and is currently estimated at $376,568, approximately $195 per square foot. 107 Miners Ct is a home located in Delaware County with nearby schools including Robert F. Schultz Elementary School, John C. Dempsey Middle School, and Rutherford B. Hayes High School.
Ownership History
Date
Name
Owned For
Owner Type
Purchase Details
Closed on
Jun 27, 2003
Sold by
Stephens Jerry C and Stephens Jeanie E
Bought by
Davenport Kenneth S and Davenport Dodie M
Current Estimated Value
Home Financials for this Owner
Home Financials are based on the most recent Mortgage that was taken out on this home.
Original Mortgage
$122,400
Outstanding Balance
$52,195
Interest Rate
5.3%
Mortgage Type
Purchase Money Mortgage
Estimated Equity
$324,373
Purchase Details
Closed on
May 26, 1999
Sold by
Rockford Homes Inc
Bought by
Stephens Jerry C and Stephens Jeanie E
Home Financials for this Owner
Home Financials are based on the most recent Mortgage that was taken out on this home.
Original Mortgage
$113,900
Interest Rate
6.92%
Mortgage Type
New Conventional
Purchase Details
Closed on
Nov 13, 1998
Sold by
Parkwood Properties Inc
Bought by
Rockford Homes Inc
Create a Home Valuation Report for This Property
The Home Valuation Report is an in-depth analysis detailing your home's value as well as a comparison with similar homes in the area
Home Values in the Area
Average Home Value in this Area
Purchase History
| Date | Buyer | Sale Price | Title Company |
|---|---|---|---|
| Davenport Kenneth S | $153,000 | Multiple | |
| Stephens Jerry C | $134,000 | -- | |
| Rockford Homes Inc | $49,500 | -- |
Source: Public Records
Mortgage History
| Date | Status | Borrower | Loan Amount |
|---|---|---|---|
| Open | Davenport Kenneth S | $122,400 | |
| Closed | Stephens Jerry C | $113,900 | |
| Closed | Davenport Kenneth S | $15,300 |
Source: Public Records
Tax History Compared to Growth
Tax History
| Year | Tax Paid | Tax Assessment Tax Assessment Total Assessment is a certain percentage of the fair market value that is determined by local assessors to be the total taxable value of land and additions on the property. | Land | Improvement |
|---|---|---|---|---|
| 2024 | $5,316 | $112,600 | $20,440 | $92,160 |
| 2023 | $5,326 | $112,600 | $20,440 | $92,160 |
| 2022 | $4,353 | $79,870 | $14,000 | $65,870 |
| 2021 | $4,450 | $79,870 | $14,000 | $65,870 |
| 2020 | $4,500 | $79,870 | $14,000 | $65,870 |
| 2019 | $3,875 | $62,340 | $11,660 | $50,680 |
| 2018 | $3,929 | $62,340 | $11,660 | $50,680 |
| 2017 | $3,390 | $49,920 | $9,140 | $40,780 |
| 2016 | $2,871 | $49,920 | $9,140 | $40,780 |
| 2015 | $2,887 | $49,920 | $9,140 | $40,780 |
| 2014 | $2,933 | $49,920 | $9,140 | $40,780 |
| 2013 | $2,949 | $49,920 | $9,140 | $40,780 |
Source: Public Records
Map
Nearby Homes
- 106 Gold Dust Ct
- 175 Firestone Dr
- 189 Delaware Dr
- 362 Hearthstone Dr
- 644 Boulder Dr
- 0 South St
- 431 Wheatfield Dr
- 413 Steeplechase St
- 336 Onyx Ln
- 383 Wheatfield Dr
- 72 Colfret Ct
- 195 Lenell Loop
- 177 Richards Dr
- 292 Lenell Loop
- 231 Rockmill St
- 547 Pagoda Loop
- 327 Rockmill St
- 123 Helen Ct
- 50 Perkins Ave
- 448 W William St
- 115 Miners Ct
- 101 Miners Ct
- 121 Miners Ct
- 100 Gold Dust Ct
- 112 Gold Dust Ct
- 106 Miners Ct
- 100 Miners Ct
- 112 Miners Ct
- 127 Miners Ct
- 0 Gold Dust Ct
- 236 Firestone Dr
- 242 Firestone Dr
- 118 Gold Dust Ct
- 230 Firestone Dr
- 118 Miners Ct
- 248 Firestone Dr
- 133 Miners Ct
- 224 Firestone Dr
- 254 Firestone Dr
- 124 Miners Ct