N
Landlord's Agent in 2021
Natalie Roome
Coldwell Banker Realty - Brookline
Estimated Value: $1,476,000 - $2,080,000
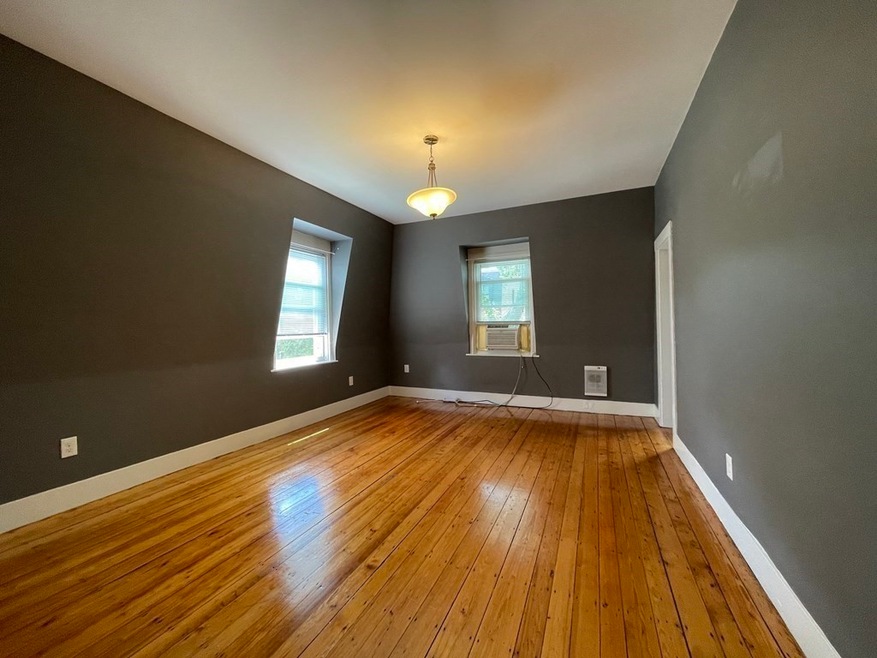
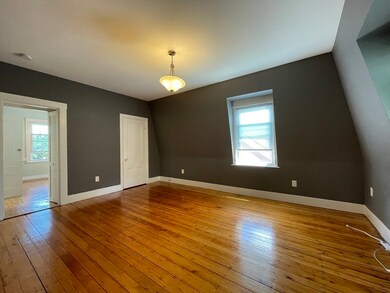
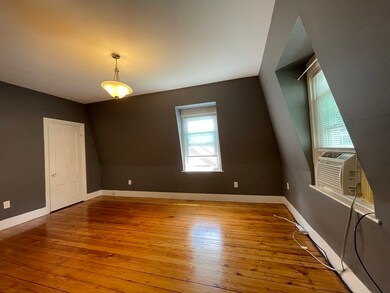
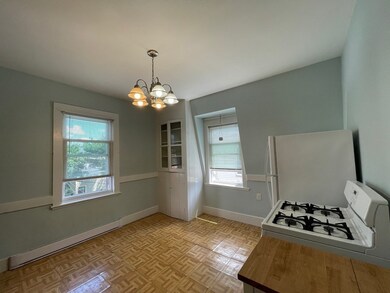
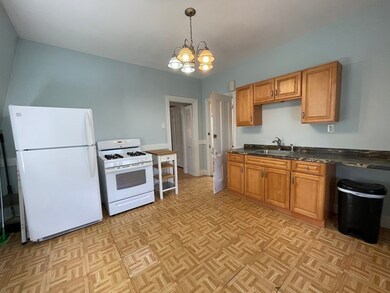
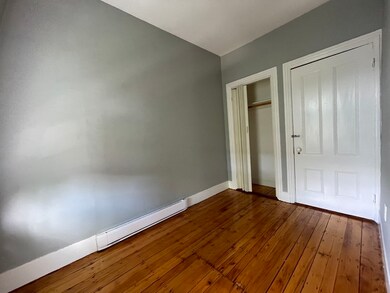
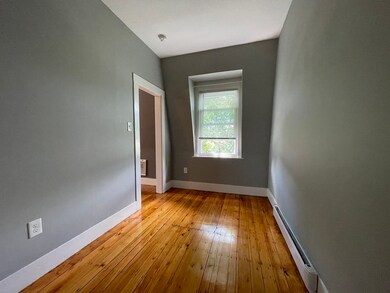
Large Sunny "Bigger than a Studio" unit in great location available Sept 1! Studio/1BR Hybrid. Make your nest on the 3rd floor - top level of this bright and sunny 1854 Mansard Style 3-family home in this East Cambridge neighborhood. Very clean space with High Ceilings. Newly painted unit. Eat in Kitchen with lots of built-in storage and gas oven/stove. Hardwood floors throughout + parquet floor in kitchen. Bathroom is currently being fully renovated to be ready for you! Just 1 block over from everything Cambridge Street has to offer - restaurants, retail, etc. Newer Tilt-In to Clean Windows. Self-cleaning stove and refrigerator like new! Close to Kendall Square/MIT plus Galleria Mall + Lechmere Station. First, last, security + full broker's fee to sign a lease. Must have landlord references + good credit. Sorry no pets.
Last Agent to Rent the Property
Natalie Roome
Coldwell Banker Realty - Brookline License #449591825 Listed on: 07/02/2021

| Date | Buyer | Sale Price | Title Company |
|---|---|---|---|
| Gannon Ft | -- | -- |
| Date | Event | Price | List to Sale | Price per Sq Ft |
|---|---|---|---|---|
| 07/20/2021 07/20/21 | Rented | $1,800 | 0.0% | -- |
| 07/05/2021 07/05/21 | Under Contract | -- | -- | -- |
| 07/02/2021 07/02/21 | For Rent | $1,800 | +20.0% | -- |
| 10/24/2018 10/24/18 | Rented | $1,500 | -6.3% | -- |
| 10/19/2018 10/19/18 | Under Contract | -- | -- | -- |
| 10/16/2018 10/16/18 | For Rent | $1,600 | -- | -- |
| Year | Tax Paid | Tax Assessment Tax Assessment Total Assessment is a certain percentage of the fair market value that is determined by local assessors to be the total taxable value of land and additions on the property. | Land | Improvement |
|---|---|---|---|---|
| 2025 | $12,887 | $2,029,500 | $503,000 | $1,526,500 |
| 2024 | $11,957 | $2,019,700 | $549,700 | $1,470,000 |
| 2023 | $10,697 | $1,825,400 | $512,200 | $1,313,200 |
| 2022 | $10,052 | $1,697,900 | $538,500 | $1,159,400 |
| 2021 | $9,429 | $1,611,800 | $517,100 | $1,094,700 |
| 2020 | $9,109 | $1,584,200 | $520,900 | $1,063,300 |
| 2019 | $11,465 | $1,499,500 | $510,900 | $988,600 |
| 2018 | $9,734 | $1,312,900 | $423,700 | $889,200 |
| 2017 | $7,855 | $1,210,300 | $378,800 | $831,500 |
| 2016 | $7,425 | $1,062,200 | $296,600 | $765,600 |
| 2015 | $7,183 | $918,600 | $254,200 | $664,400 |
| 2014 | $6,563 | $783,200 | $196,900 | $586,300 |
N
Landlord's Agent in 2021
Natalie Roome
Coldwell Banker Realty - Brookline
Tenant's Agent in 2021
Courtney Wood
Amo Realty - Boston City Properties
(508) 335-1010
Source: MLS Property Information Network (MLS PIN)
MLS Number: 72859507
APN: CAMB-000023-000000-000100
Disclaimer: Certain information contained herein is derived from information provided by parties other than Homes.com. All information provided is deemed reliable, but is not guaranteed to be accurate and should be independently verified.
![]() The property listing data and information, or the Images, set forth herein were provided to MLS Property Information Network, Inc. from third party sources, including sellers, lessors and public records, and were compiled by MLS Property Information Network, Inc. The property listing data and information, and the Images, are for the personal, non-commercial use of consumers having a good faith interest in purchasing or leasing listed properties of the type displayed to them and may not be used for any purpose other than to identify prospective properties which such consumers may have a good faith interest in purchasing or leasing. MLS Property Information Network, Inc. and its subscribers disclaim any and all representations and warranties as to the accuracy of the property listing data and information, or as to the accuracy of any of the Images, set forth herein.
The property listing data and information, or the Images, set forth herein were provided to MLS Property Information Network, Inc. from third party sources, including sellers, lessors and public records, and were compiled by MLS Property Information Network, Inc. The property listing data and information, and the Images, are for the personal, non-commercial use of consumers having a good faith interest in purchasing or leasing listed properties of the type displayed to them and may not be used for any purpose other than to identify prospective properties which such consumers may have a good faith interest in purchasing or leasing. MLS Property Information Network, Inc. and its subscribers disclaim any and all representations and warranties as to the accuracy of the property listing data and information, or as to the accuracy of any of the Images, set forth herein.