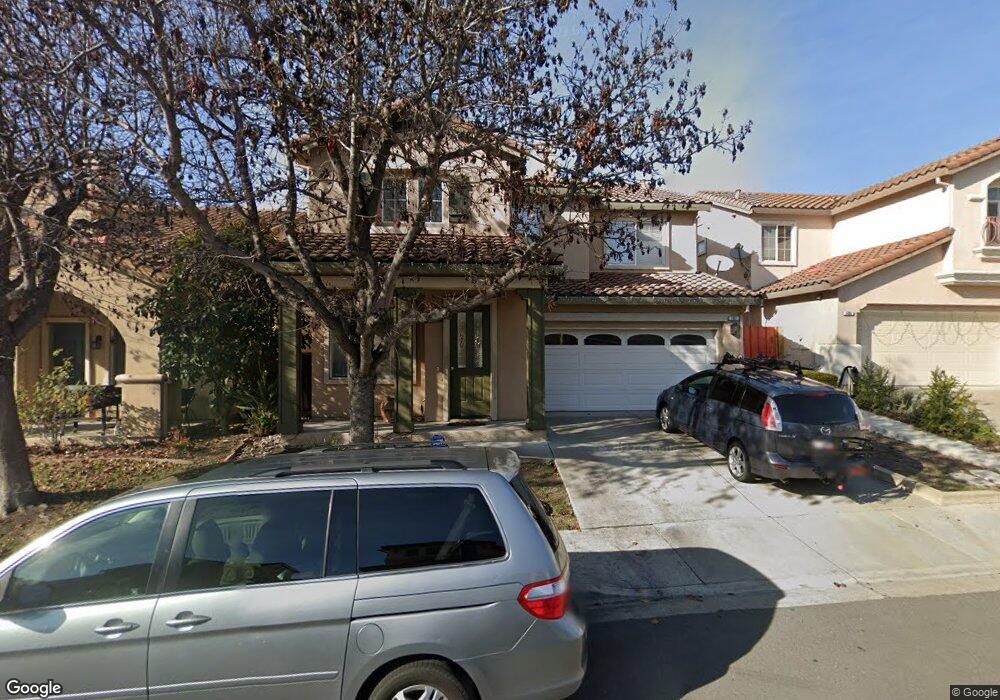
107 Pear Ln Union City, CA 94587
Downtown Union City NeighborhoodEstimated Value: $492,000 - $1,624,000
4
Beds
3
Baths
1,914
Sq Ft
$650/Sq Ft
Est. Value
About This Home
This home is located at 107 Pear Ln, Union City, CA 94587 and is currently estimated at $1,244,790, approximately $650 per square foot. 107 Pear Ln is a home located in Alameda County with nearby schools including Guy Jr. Emanuele Elementary School, Cesar Chavez Middle School, and James Logan High School.
Ownership History
Date
Name
Owned For
Owner Type
Purchase Details
Closed on
Feb 4, 2013
Sold by
Huang Chayou Stacy
Bought by
Wan Louis
Current Estimated Value
Home Financials for this Owner
Home Financials are based on the most recent Mortgage that was taken out on this home.
Original Mortgage
$408,000
Outstanding Balance
$283,627
Interest Rate
3.29%
Mortgage Type
New Conventional
Estimated Equity
$961,163
Purchase Details
Closed on
Dec 17, 2008
Sold by
Wan Louis
Bought by
Wan Louis P
Home Financials for this Owner
Home Financials are based on the most recent Mortgage that was taken out on this home.
Original Mortgage
$396,000
Interest Rate
6.1%
Mortgage Type
New Conventional
Purchase Details
Closed on
Oct 12, 1998
Sold by
Catellus Residential Group Inc
Bought by
Wan Louis
Home Financials for this Owner
Home Financials are based on the most recent Mortgage that was taken out on this home.
Original Mortgage
$265,850
Interest Rate
6.71%
Create a Home Valuation Report for This Property
The Home Valuation Report is an in-depth analysis detailing your home's value as well as a comparison with similar homes in the area
Home Values in the Area
Average Home Value in this Area
Purchase History
| Date | Buyer | Sale Price | Title Company |
|---|---|---|---|
| Wan Louis | -- | Chicago Title Company | |
| Wan Louis | -- | Chicago Title Company | |
| Wan Louis P | -- | Chicago Title Company | |
| Wan Louis | $333,000 | First American Title Guarant |
Source: Public Records
Mortgage History
| Date | Status | Borrower | Loan Amount |
|---|---|---|---|
| Open | Wan Louis | $408,000 | |
| Closed | Wan Louis | $408,000 | |
| Previous Owner | Wan Louis P | $396,000 | |
| Previous Owner | Wan Louis | $265,850 |
Source: Public Records
Tax History
| Year | Tax Paid | Tax Assessment Tax Assessment Total Assessment is a certain percentage of the fair market value that is determined by local assessors to be the total taxable value of land and additions on the property. | Land | Improvement |
|---|---|---|---|---|
| 2025 | $8,377 | $513,919 | $156,291 | $364,628 |
| 2024 | $8,377 | $503,707 | $153,227 | $357,480 |
| 2023 | $8,096 | $500,695 | $150,223 | $350,472 |
| 2022 | $7,943 | $483,879 | $147,278 | $343,601 |
| 2021 | $7,766 | $474,256 | $144,391 | $336,865 |
| 2020 | $7,609 | $476,321 | $142,910 | $333,411 |
| 2019 | $7,660 | $466,984 | $140,109 | $326,875 |
| 2018 | $7,482 | $457,828 | $137,362 | $320,466 |
| 2017 | $7,304 | $448,853 | $134,669 | $314,184 |
| 2016 | $7,048 | $440,054 | $132,029 | $308,025 |
| 2015 | $6,911 | $433,444 | $130,046 | $303,398 |
| 2014 | $6,659 | $424,954 | $127,499 | $297,455 |
Source: Public Records
Map
Nearby Homes
- 110 Pear Ln
- 116 Mahogany Ln
- 235 Famoso Plaza
- 152 Aurora Plaza
- 245 Famoso Plaza
- 267 Famoso Plaza
- 165 Aurora Plaza
- 1059 Sapphire Terrace Unit 353
- 35185 11th St Unit 274
- 352 Monte Carlo Ave
- 351 Riviera Dr
- 35172 King Ct
- 35530 Monterra Terrace Unit 303
- 33941 9th St
- 2113 Wren Ct
- 394 Appian Way
- 34749 Alvarado Niles Rd Unit 4
- 33848 10th St
- 33840 10th St
- 33853 10th St
- 109 Pear Ln
- 105 Pear Ln
- 108 Windflower Ln
- 106 Windflower Ln
- 111 Pear Ln
- 104 Windflower Ln
- 110 Windflower Ln
- 106 Pear Ln
- 104 Pear Ln
- 108 Pear Ln
- 34513 Windflower Ln
- 34509 Windflower Ln
- 34517 Windflower Ln
- 34505 Windflower Ln
- 34521 Windflower Ln
- 34501 Windflower Ln
- 107 Pepper Ln
- 105 Pepper Ln
- 109 Pepper Ln
- 34525 Windflower Ln
Your Personal Tour Guide
Ask me questions while you tour the home.