Estimated Value: $681,000 - $778,000
3
Beds
2
Baths
1,704
Sq Ft
$425/Sq Ft
Est. Value
About This Home
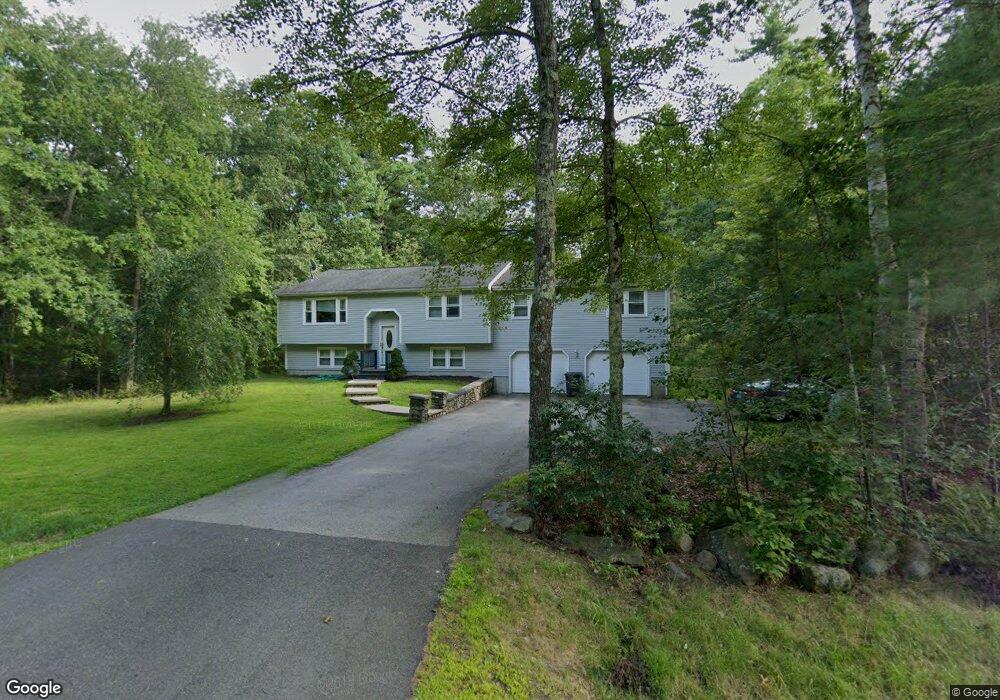
This home is located at 107 Pelham Rd, Salem, NH 03079 and is currently estimated at $723,738, approximately $424 per square foot. 107 Pelham Rd is a home located in Rockingham County with nearby schools including Mary A. Fisk Elementary School, Woodbury School, and Salem High School.
Ownership History
Date
Name
Owned For
Owner Type
Purchase Details
Closed on
Apr 30, 2015
Sold by
Capra Chad
Bought by
Capra Kellie
Current Estimated Value
Home Financials for this Owner
Home Financials are based on the most recent Mortgage that was taken out on this home.
Original Mortgage
$223,100
Outstanding Balance
$172,366
Interest Rate
3.76%
Mortgage Type
New Conventional
Estimated Equity
$551,372
Purchase Details
Closed on
Feb 27, 2004
Sold by
Qin Zubing
Bought by
Capra Chad and Capra Kellie
Home Financials for this Owner
Home Financials are based on the most recent Mortgage that was taken out on this home.
Original Mortgage
$252,000
Interest Rate
5.65%
Mortgage Type
Purchase Money Mortgage
Purchase Details
Closed on
Sep 11, 2000
Sold by
Stead David P and Seller Unknown
Bought by
Qin Subing
Home Financials for this Owner
Home Financials are based on the most recent Mortgage that was taken out on this home.
Original Mortgage
$192,000
Interest Rate
8.1%
Mortgage Type
Purchase Money Mortgage
Create a Home Valuation Report for This Property
The Home Valuation Report is an in-depth analysis detailing your home's value as well as a comparison with similar homes in the area
Home Values in the Area
Average Home Value in this Area
Purchase History
| Date | Buyer | Sale Price | Title Company |
|---|---|---|---|
| Capra Kellie | -- | -- | |
| Capra Chad | $252,000 | -- | |
| Qin Subing | $240,000 | -- |
Source: Public Records
Mortgage History
| Date | Status | Borrower | Loan Amount |
|---|---|---|---|
| Open | Qin Subing | $223,100 | |
| Previous Owner | Qin Subing | $252,000 | |
| Previous Owner | Qin Subing | $192,000 |
Source: Public Records
Tax History Compared to Growth
Tax History
| Year | Tax Paid | Tax Assessment Tax Assessment Total Assessment is a certain percentage of the fair market value that is determined by local assessors to be the total taxable value of land and additions on the property. | Land | Improvement |
|---|---|---|---|---|
| 2024 | $9,361 | $531,900 | $194,300 | $337,600 |
| 2023 | $9,021 | $531,900 | $194,300 | $337,600 |
| 2022 | $8,537 | $531,900 | $194,300 | $337,600 |
| 2021 | $8,500 | $531,900 | $194,300 | $337,600 |
| 2020 | $7,595 | $344,900 | $138,900 | $206,000 |
| 2019 | $7,581 | $344,900 | $138,900 | $206,000 |
| 2018 | $7,315 | $338,500 | $138,900 | $199,600 |
| 2017 | $7,054 | $338,500 | $138,900 | $199,600 |
| 2016 | $6,916 | $338,500 | $138,900 | $199,600 |
| 2015 | $6,378 | $298,200 | $137,700 | $160,500 |
| 2014 | $6,200 | $298,200 | $137,700 | $160,500 |
| 2013 | $6,101 | $298,200 | $137,700 | $160,500 |
Source: Public Records
Map
Nearby Homes
- 6-18 Mary Anthony Dr
- 3 Sycamore Ave
- 133 Brookdale Rd
- 38 Rosemary St
- 56 Nelson St
- 19A Winter St
- 92 Lowell Rd
- 108 S Shore Rd
- 26 Plower Rd Unit 6
- 3 S Shore Rd
- 1 Squire Armour Rd
- 3 Kennedy Dr
- 2 Baker Rd
- 75 S Policy St Unit 45
- 75 S Policy St Unit 48
- 17 Clinton St
- 11 Surrey Ln
- 45 Sharon Rd
- 11 Sullivan Ct
- 3 Carmel Rd