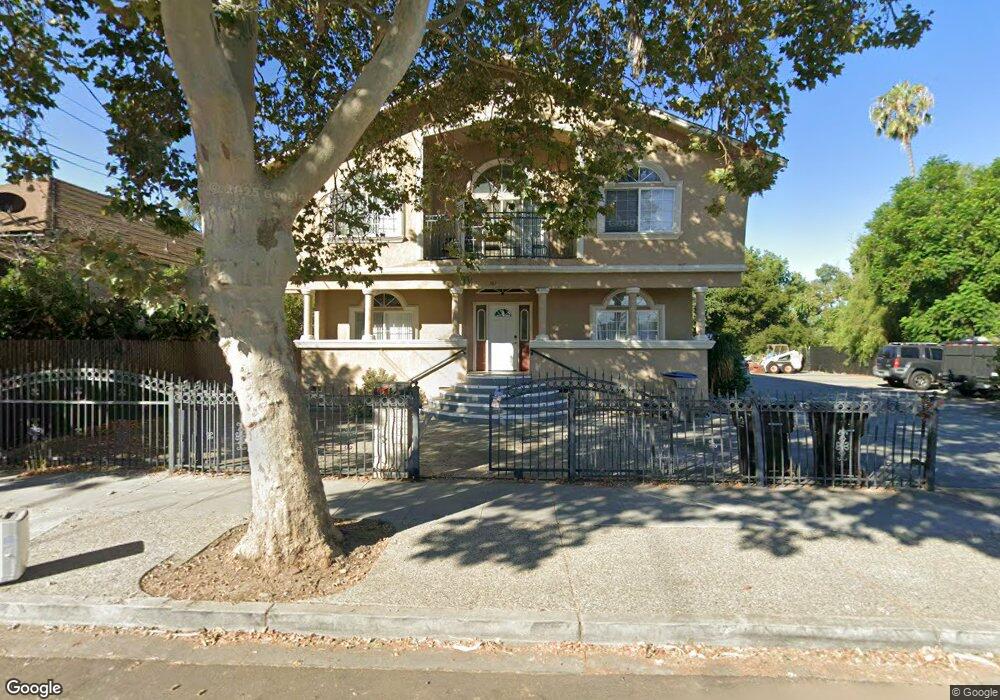
107 S 19th St San Jose, CA 95116
Brookwood Terrace NeighborhoodEstimated Value: $2,150,000 - $2,740,000
8
Beds
6
Baths
4,400
Sq Ft
$557/Sq Ft
Est. Value
About This Home
This home is located at 107 S 19th St, San Jose, CA 95116 and is currently estimated at $2,452,537, approximately $557 per square foot. 107 S 19th St is a home located in Santa Clara County with nearby schools including Selma Olinder Elementary School, Muwekma Ohlone Middle, and San Jose High School.
Ownership History
Date
Name
Owned For
Owner Type
Purchase Details
Closed on
Oct 31, 2016
Sold by
Li Hungwen and Li Hung Ying
Bought by
Tsai Benjamin and Wu Lily
Current Estimated Value
Home Financials for this Owner
Home Financials are based on the most recent Mortgage that was taken out on this home.
Original Mortgage
$660,000
Outstanding Balance
$541,709
Interest Rate
4.15%
Mortgage Type
Adjustable Rate Mortgage/ARM
Estimated Equity
$1,910,828
Purchase Details
Closed on
Oct 17, 2016
Sold by
Tsai Benjamin and Wu Lily
Bought by
Tsai Benjamin and Wu Lily
Home Financials for this Owner
Home Financials are based on the most recent Mortgage that was taken out on this home.
Original Mortgage
$660,000
Outstanding Balance
$541,709
Interest Rate
4.15%
Mortgage Type
Adjustable Rate Mortgage/ARM
Estimated Equity
$1,910,828
Purchase Details
Closed on
Jan 10, 2014
Sold by
Li Hungwen and Li Hung Ying
Bought by
Li Hungwen and Li Hung Ying
Purchase Details
Closed on
Jan 30, 2013
Sold by
Mulkerin John P and Mulkerin Kil C
Bought by
Li Hungwen and Li Hung Ying
Purchase Details
Closed on
Mar 3, 2009
Sold by
Us Bank Na
Bought by
Mulkerin John P and Mulkerin Kil C
Purchase Details
Closed on
Sep 25, 2008
Sold by
Quach Kevin K
Bought by
Us Bank Na
Purchase Details
Closed on
Dec 29, 2003
Sold by
Le Liem Quoc
Bought by
Quach Kevin K
Home Financials for this Owner
Home Financials are based on the most recent Mortgage that was taken out on this home.
Original Mortgage
$975,000
Interest Rate
6%
Mortgage Type
New Conventional
Purchase Details
Closed on
Oct 8, 2002
Sold by
Quach Kevin K
Bought by
Quach Kevin K and Le Liem Quoc
Home Financials for this Owner
Home Financials are based on the most recent Mortgage that was taken out on this home.
Original Mortgage
$230,000
Interest Rate
6.32%
Mortgage Type
Credit Line Revolving
Purchase Details
Closed on
Oct 23, 2000
Sold by
Quoc Le Liem and Erik Banh
Bought by
Quach Kevin K
Home Financials for this Owner
Home Financials are based on the most recent Mortgage that was taken out on this home.
Original Mortgage
$522,500
Interest Rate
7.89%
Purchase Details
Closed on
Aug 7, 2000
Sold by
Quoc Le Liem and Erik Banh
Bought by
Le Liem Quoc and Banh Erik
Purchase Details
Closed on
Feb 9, 1998
Sold by
Martinez Daniel E and Martinez Anna M
Bought by
Le Liem Quoc and Banh Erik
Home Financials for this Owner
Home Financials are based on the most recent Mortgage that was taken out on this home.
Original Mortgage
$148,365
Interest Rate
6.99%
Create a Home Valuation Report for This Property
The Home Valuation Report is an in-depth analysis detailing your home's value as well as a comparison with similar homes in the area
Home Values in the Area
Average Home Value in this Area
Purchase History
| Date | Buyer | Sale Price | Title Company |
|---|---|---|---|
| Tsai Benjamin | $700,000 | First American Title Company | |
| Tsai Benjamin | -- | First American Title Company | |
| Li Hungwen | -- | None Available | |
| Li Hungwen | $965,000 | Stewart Title Of California | |
| Mulkerin John P | $799,000 | First American Title Company | |
| Us Bank Na | $990,239 | None Available | |
| Quach Kevin K | $675,000 | Alliance Title Company | |
| Quach Kevin K | $115,000 | Alliance Title Company | |
| Quach Kevin K | -- | Alliance Title Company | |
| Le Liem Quoc | -- | -- | |
| Le Liem Quoc | $165,000 | Commonwealth Land Title Co |
Source: Public Records
Mortgage History
| Date | Status | Borrower | Loan Amount |
|---|---|---|---|
| Open | Tsai Benjamin | $660,000 | |
| Previous Owner | Quach Kevin K | $975,000 | |
| Previous Owner | Quach Kevin K | $230,000 | |
| Previous Owner | Quach Kevin K | $522,500 | |
| Previous Owner | Le Liem Quoc | $148,365 | |
| Closed | Quach Kevin K | $375,000 |
Source: Public Records
Tax History Compared to Growth
Tax History
| Year | Tax Paid | Tax Assessment Tax Assessment Total Assessment is a certain percentage of the fair market value that is determined by local assessors to be the total taxable value of land and additions on the property. | Land | Improvement |
|---|---|---|---|---|
| 2025 | $22,954 | $1,670,503 | $720,100 | $950,403 |
| 2024 | $22,954 | $1,637,749 | $705,981 | $931,768 |
| 2023 | $22,502 | $1,605,638 | $692,139 | $913,499 |
| 2022 | $22,228 | $1,574,156 | $678,568 | $895,588 |
| 2021 | $21,692 | $1,543,291 | $665,263 | $878,028 |
| 2020 | $20,974 | $1,527,467 | $658,442 | $869,025 |
| 2019 | $19,571 | $1,497,518 | $645,532 | $851,986 |
| 2018 | $19,364 | $1,468,156 | $632,875 | $835,281 |
| 2017 | $19,205 | $1,439,369 | $620,466 | $818,903 |
| 2016 | $16,710 | $1,226,783 | $610,988 | $615,795 |
| 2015 | $16,616 | $1,208,357 | $601,811 | $606,546 |
| 2014 | $12,682 | $969,380 | $630,047 | $339,333 |
Source: Public Records
Map
Nearby Homes
- 850 Calhoun St
- 18 S 21st St Unit 200
- 30 S 22nd St Unit 6
- 30 S 22nd St Unit 2
- 39 S 23rd St
- 214 S 22nd St
- 199 S 23rd St
- 188 S 14th St
- 55 Carnegie Square
- 551 S 15th St
- 75 S 24th St
- 396 S 18th St
- 987 E William St
- 255 S 24th St
- 101 S 13th St
- 351 S 23rd St Unit A
- 1236 Whitton Ave
- 445 S 22nd St
- 339 S 13th St
- 415 S 14th St
- 111 S 19th St
- 127 S 19th St
- 93 S 19th St
- 114 S 19th St Unit 5
- 114 S 19th St
- 102 S 19th St
- 139 S 19th St
- 85 S 19th St
- 126 S 19th St
- 134 S 19th St
- 75 S 19th St
- 76 S 19th St
- 903 E San Fernando St
- 142 S 19th St
- 153 S 19th St Unit 1
- 930-105 S East San Fernando 20th St
- 155 S 19th St
- 150 Arroyo Way
- 68 S 19th St
- 120 Arroyo Way