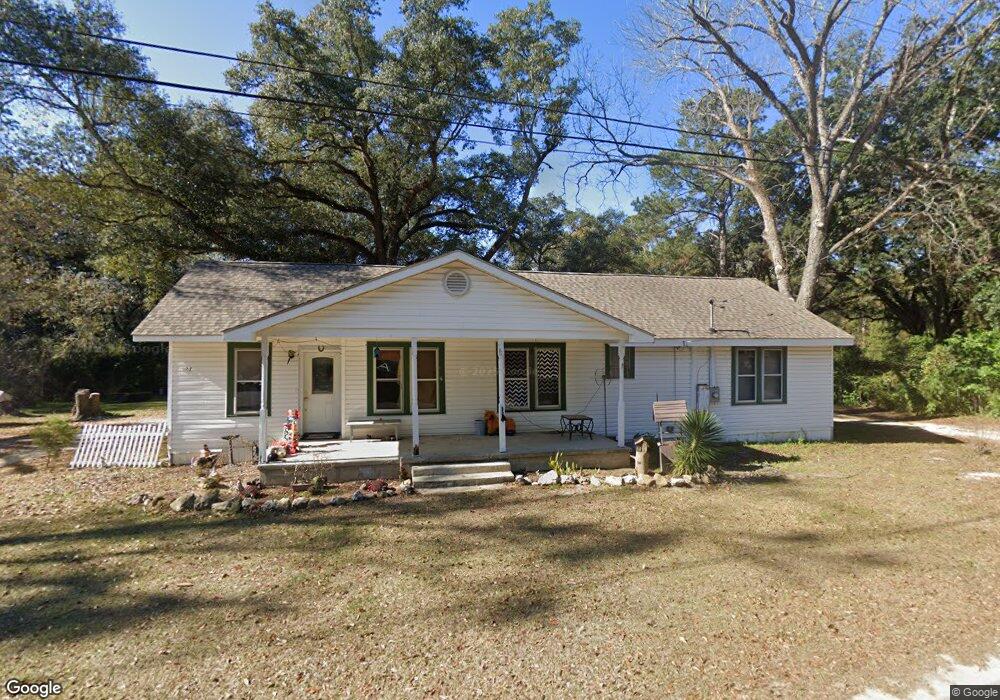
107 Thomas St Bainbridge, GA 39817
Estimated Value: $112,623 - $122,000
--
Bed
1
Bath
1,579
Sq Ft
$75/Sq Ft
Est. Value
About This Home
This home is located at 107 Thomas St, Bainbridge, GA 39817 and is currently estimated at $117,874, approximately $74 per square foot. 107 Thomas St is a home located in Decatur County with nearby schools including Bainbridge High School and Grace Christian Academy.
Ownership History
Date
Name
Owned For
Owner Type
Purchase Details
Closed on
Sep 12, 2019
Sold by
Knight Michael G
Bought by
Dollar Dennis
Current Estimated Value
Purchase Details
Closed on
Mar 30, 2018
Sold by
Knight Winston Terrell
Bought by
Knight Michael G
Purchase Details
Closed on
Feb 3, 2014
Sold by
Overstreet Crystal Anne
Bought by
Knight Michael G
Purchase Details
Closed on
Jan 27, 2014
Sold by
West Walter
Bought by
Knight Michael G
Purchase Details
Closed on
Sep 18, 2012
Sold by
Knight Charlotte F
Bought by
Knight Michael G and Overstreet Crystal Anne
Purchase Details
Closed on
Oct 7, 2009
Sold by
Knight Michael G
Bought by
Knight Charlotte F
Purchase Details
Closed on
Oct 30, 2006
Sold by
Knight Jerry L
Bought by
Knight Michael G
Home Financials for this Owner
Home Financials are based on the most recent Mortgage that was taken out on this home.
Original Mortgage
$63,995
Interest Rate
6.27%
Mortgage Type
FHA
Purchase Details
Closed on
Jul 5, 2005
Sold by
Knight Jerry L
Bought by
Knight Jerry L and Gause Anne M
Create a Home Valuation Report for This Property
The Home Valuation Report is an in-depth analysis detailing your home's value as well as a comparison with similar homes in the area
Home Values in the Area
Average Home Value in this Area
Purchase History
| Date | Buyer | Sale Price | Title Company |
|---|---|---|---|
| Dollar Dennis | $10,000 | -- | |
| Knight Michael G | -- | -- | |
| Knight Michael G | -- | -- | |
| Knight Michael G | -- | -- | |
| West Walter | -- | -- | |
| Knight Michael G | -- | -- | |
| Knight Charlotte F | $63,462 | -- | |
| Knight Michael G | $65,000 | -- | |
| Knight Jerry L | -- | -- |
Source: Public Records
Mortgage History
| Date | Status | Borrower | Loan Amount |
|---|---|---|---|
| Previous Owner | Knight Michael G | $63,995 |
Source: Public Records
Tax History Compared to Growth
Tax History
| Year | Tax Paid | Tax Assessment Tax Assessment Total Assessment is a certain percentage of the fair market value that is determined by local assessors to be the total taxable value of land and additions on the property. | Land | Improvement |
|---|---|---|---|---|
| 2024 | $840 | $26,569 | $2,305 | $24,264 |
| 2023 | $735 | $23,334 | $2,305 | $21,029 |
| 2022 | $720 | $23,334 | $2,305 | $21,029 |
| 2021 | $650 | $20,513 | $2,305 | $18,208 |
| 2020 | $134 | $9,993 | $2,305 | $7,688 |
| 2019 | $332 | $9,545 | $2,305 | $7,240 |
| 2018 | $702 | $22,215 | $2,305 | $19,910 |
| 2017 | $750 | $21,457 | $2,288 | $19,169 |
| 2016 | $690 | $21,456 | $2,288 | $19,169 |
| 2015 | $771 | $21,456 | $2,288 | $19,169 |
| 2014 | $715 | $21,456 | $2,288 | $19,169 |
| 2013 | -- | $21,456 | $2,287 | $19,168 |
Source: Public Records
Map
Nearby Homes
- 00 Dothan Rd
- Lot Griffin St
- 000 Conger Dr
- 1302 Talmadge St
- LOT 9 BL Mountainview Way
- Lots Lott 19 & 20
- 1603 Plantation Rd
- 604 Martin St
- 467 745 Lot St N
- 850 Zorn Rd
- 719 W Shotwell St
- 2400 Airport Rd Unit 6
- 2400 Airport Rd
- 415 Charles St
- 302 E Water St
- 210 W Evans St
- 306 S Broad St
- 836 Cooper St
- 249 Meredith Dr
- 245 Meredith Dr
- 108 Thomas St
- 103 Thomas St
- 1602 Dothan Rd
- 106 Thomas St
- 110 Thomas St
- 115 Thomas St
- 112 Thomas St
- 104 Thomas St
- 1507 Arthur St
- Lot C014 Georgia 253
- Lot 13 Georgia 253
- Lot Georgia 253
- Lot 9 Georgia 253
- Lot 5 Georgia 253
- Lot 7 Georgia 253
- Lot 4 Georgia 253
- Lot 12 Georgia 253
- Lot 11 Georgia 253
- Lot 10 Georgia 253
- Lot 8 Georgia 253