
Seller's Agent in 2026
Laura Rosen
Long & Foster
(443) 865-5356
5 in this area
60 Total Sales
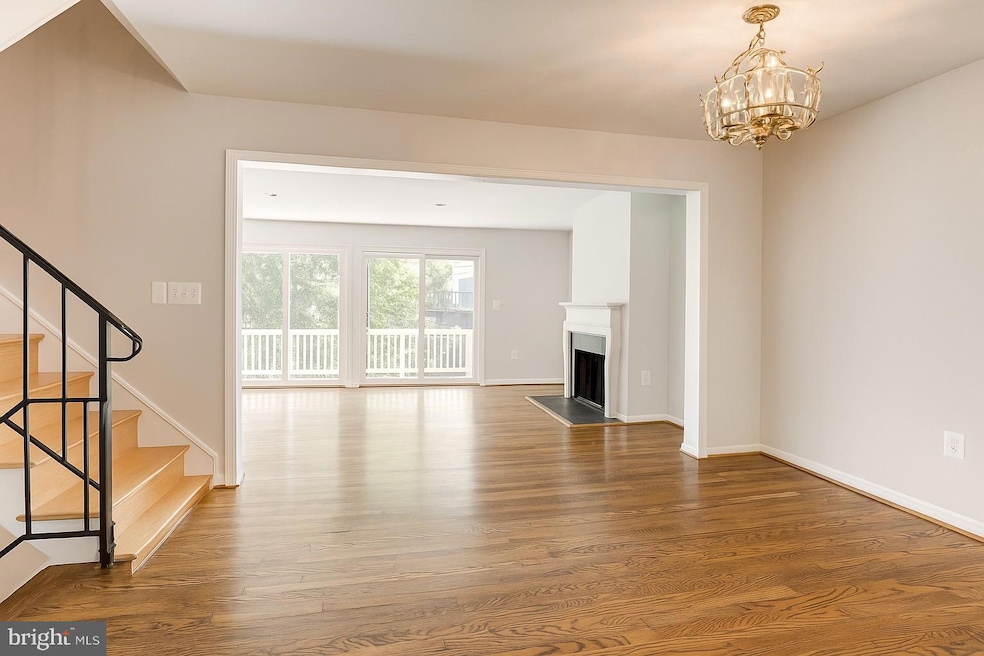
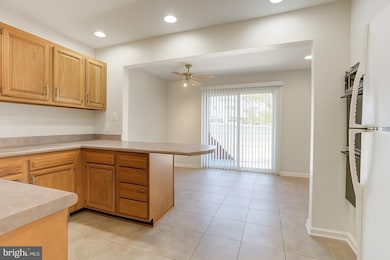
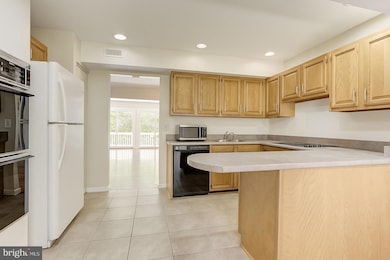
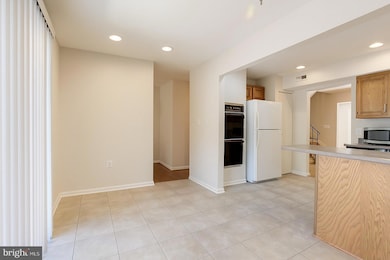
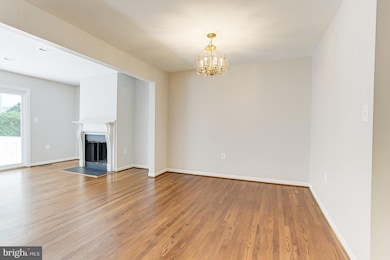
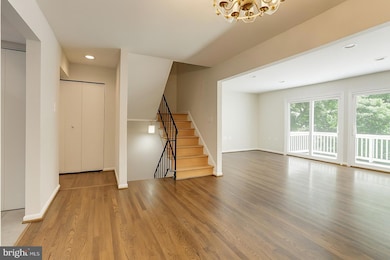
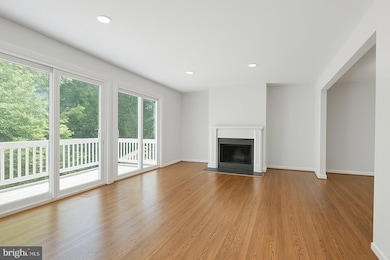
VERY EXCITED TO SHARE THE NEWLY PAINTED INTERIOR OF THIS HOME!! Come tour it again if you previously saw it! This beautiful 3 BR 2.5 BA Brick townhome in the sought after Community of Greengate -Located between Falls Rd & Greenspring Ave also considered the Mt Washington Area, Baltimore County. This spacious townhome provides lots of living space with a total SF of 2460 SF. The townhome has an open feeling with a large living room that extends off the dining room. The double set of new Pella sliding glass doors (2022) provides ample natural sunlight and access to the deck. Cozy up to the fireplace for a nice evening. The kitchen provides 2 wall ovens that are amazing, a cooktop and lots of counter space and cabinets for easy meal preparation. Enjoy the extra large breakfast room with Pella sliders (2022) to the front patio. On the upper level, 3 large size bedrooms and oversized closets with closet system organizers, are a bonus. Both the hall bathroom and the primary ensuite bathroom were beautifully renovated in 2013. The lower level includes a full size family room with new Pella sliders (2023) to the backyard. 2 parking spaces are allocated to this home. The owner has invested and cared for this home since she purchased in 2014. Further updates include: Replaced Oil Tank 2015, Replaced HVAC 2014, Replaced Water Heater 2018, New Chimney Cap 2016 and Hardwood Floors Sanded and Sealed 2016. New Gutter Guards installed. You will love the accessibility to 83 downtown/uptown, and a quick drive to 695. Conveniently located to the Quarry, Mt Washington and Greenspring Station, which is always a plus. A short walking distance to synagogues, restaurants, grocery stores and schools makes this townhome so desirable for so many people. Looking forward to hearing how much you love this home.
Last Agent to Sell the Property
(410) 453-0500 LauraRosen@LNF.com Long & Foster Real Estate, Inc. Brokerage Phone: 4104530500 License #36255 Listed on: 10/02/2025
Last Buyer's Agent
(443) 360-5360 raphael@greensummitrealty.com Green Summit Realty, LLC License #681335
| Date | Type | Sale Price | Title Company |
|---|---|---|---|
| Deed | $364,000 | Forward Title Services | |
| Deed | $222,500 | -- | |
| Deed | $222,500 | -- | |
| Deed | -- | -- | |
| Deed | $87,500 | -- |
| Date | Status | Loan Amount | Loan Type |
|---|---|---|---|
| Open | $291,200 | New Conventional | |
| Previous Owner | $48,000 | Credit Line Revolving | |
| Previous Owner | $130,000 | New Conventional | |
| Previous Owner | $130,000 | New Conventional |
| Date | Event | Price | List to Sale | Price per Sq Ft |
|---|---|---|---|---|
| 02/06/2026 02/06/26 | Sold | $364,000 | -1.4% | $165 / Sq Ft |
| 01/08/2026 01/08/26 | Pending | -- | -- | -- |
| 12/10/2025 12/10/25 | Price Changed | $369,000 | -2.6% | $168 / Sq Ft |
| 11/13/2025 11/13/25 | Price Changed | $379,000 | -1.6% | $172 / Sq Ft |
| 10/11/2025 10/11/25 | Price Changed | $385,000 | -3.5% | $175 / Sq Ft |
| 10/02/2025 10/02/25 | For Sale | $399,000 | -- | $181 / Sq Ft |
| Year | Tax Paid | Tax Assessment Tax Assessment Total Assessment is a certain percentage of the fair market value that is determined by local assessors to be the total taxable value of land and additions on the property. | Land | Improvement |
|---|---|---|---|---|
| 2025 | $4,510 | $289,000 | $77,000 | $212,000 |
| 2024 | $4,510 | $277,533 | $0 | $0 |
| 2023 | $2,172 | $266,067 | $0 | $0 |
| 2022 | $4,141 | $254,600 | $77,000 | $177,600 |
| 2021 | $3,956 | $247,167 | $0 | $0 |
| 2020 | $3,956 | $239,733 | $0 | $0 |
| 2019 | $3,852 | $232,300 | $77,000 | $155,300 |
| 2018 | $3,704 | $223,400 | $0 | $0 |
| 2017 | $3,458 | $214,500 | $0 | $0 |
| 2016 | $3,083 | $205,600 | $0 | $0 |
| 2015 | $3,083 | $205,333 | $0 | $0 |
| 2014 | $3,083 | $205,067 | $0 | $0 |
Seller's Agent in 2026
Laura Rosen
Long & Foster
(443) 865-5356
5 in this area
60 Total Sales
Buyer's Agent in 2026
Raphael Mifsud
Green Summit Realty, LLC
(443) 360-5360
24 in this area
45 Total Sales
Source: Bright MLS
MLS Number: MDBC2141486
APN: 03-1800012851
Disclaimer: Certain information contained herein is derived from information provided by parties other than Homes.com. All information provided is deemed reliable, but is not guaranteed to be accurate and should be independently verified.
![]() The data relating to real estate for sale on this website appears in part through the BRIGHT Internet Data Exchange program, a voluntary cooperative exchange of property listing data between licensed real estate brokerage firms, and is provided by BRIGHT through a licensing agreement.
The data relating to real estate for sale on this website appears in part through the BRIGHT Internet Data Exchange program, a voluntary cooperative exchange of property listing data between licensed real estate brokerage firms, and is provided by BRIGHT through a licensing agreement.
Listing information is from various brokers who participate in the Bright MLS IDX program and not all listings may be visible on the site.
The property information being provided on or through the website is for the personal, non-commercial use of consumers and such information may not be used for any purpose other than to identify prospective properties consumers may be interested in purchasing.
Some properties which appear for sale on the website may no longer be available because they are for instance, under contract, sold or are no longer being offered for sale.
Property information displayed is deemed reliable but is not guaranteed.
Copyright 2026 Bright MLS, Inc.
Ask me questions while you tour the home.