1070 Aloha St Red Bluff, CA 96080
Estimated Value: $262,000 - $280,000
3
Beds
2
Baths
1,148
Sq Ft
$237/Sq Ft
Est. Value
About This Home
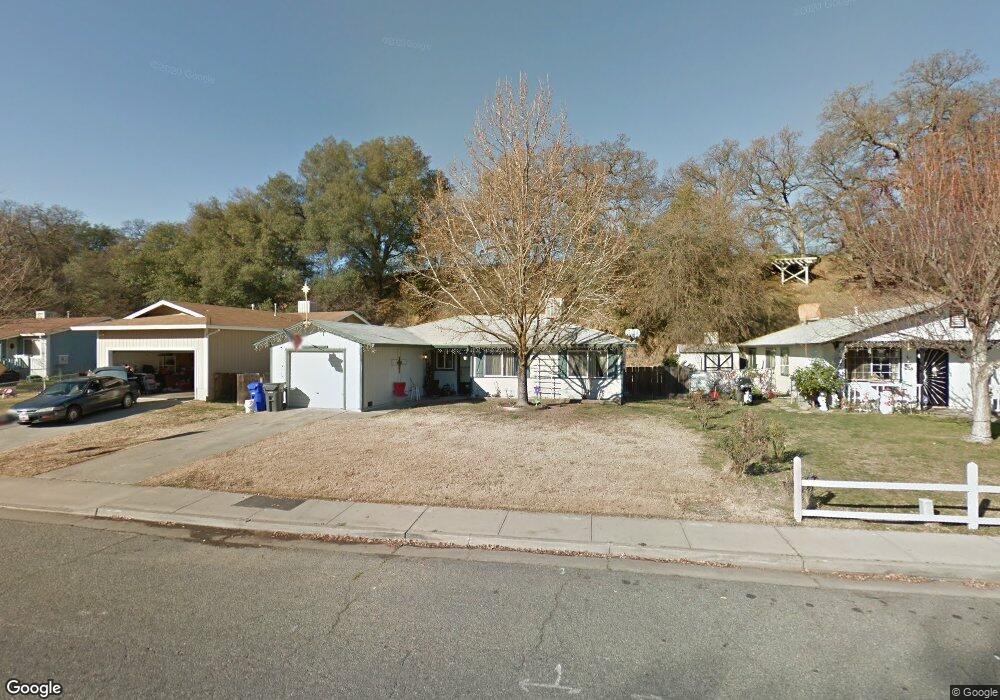
This home is located at 1070 Aloha St, Red Bluff, CA 96080 and is currently estimated at $271,628, approximately $236 per square foot. 1070 Aloha St is a home located in Tehama County with nearby schools including Jackson Heights Elementary School, Vista Preparatory Academy, and Red Bluff High School.
Ownership History
Date
Name
Owned For
Owner Type
Purchase Details
Closed on
May 10, 2024
Sold by
Brauker Austen J and Brauker Victoria
Bought by
Gonzalez Kristian Anthony
Current Estimated Value
Home Financials for this Owner
Home Financials are based on the most recent Mortgage that was taken out on this home.
Original Mortgage
$8,575
Outstanding Balance
$4,185
Interest Rate
6.88%
Mortgage Type
FHA
Estimated Equity
$267,443
Purchase Details
Closed on
May 6, 2019
Sold by
Livin Smith Lorena A
Bought by
Brauker Austen J and Brauker Victoria
Home Financials for this Owner
Home Financials are based on the most recent Mortgage that was taken out on this home.
Original Mortgage
$155,250
Interest Rate
4%
Mortgage Type
New Conventional
Purchase Details
Closed on
Feb 12, 2019
Sold by
Smith Lorena A
Bought by
Smith Lorena A
Create a Home Valuation Report for This Property
The Home Valuation Report is an in-depth analysis detailing your home's value as well as a comparison with similar homes in the area
Purchase History
| Date | Buyer | Sale Price | Title Company |
|---|---|---|---|
| Gonzalez Kristian Anthony | $245,000 | Chicago Title | |
| Brauker Austen J | $172,500 | Placer Title Co Simplifile | |
| Smith Lorena A | -- | None Available |
Source: Public Records
Mortgage History
| Date | Status | Borrower | Loan Amount |
|---|---|---|---|
| Open | Gonzalez Kristian Anthony | $8,575 | |
| Open | Gonzalez Kristian Anthony | $240,562 | |
| Previous Owner | Brauker Austen J | $155,250 |
Source: Public Records
Tax History
| Year | Tax Paid | Tax Assessment Tax Assessment Total Assessment is a certain percentage of the fair market value that is determined by local assessors to be the total taxable value of land and additions on the property. | Land | Improvement |
|---|---|---|---|---|
| 2025 | $1,957 | $249,900 | $61,200 | $188,700 |
| 2023 | $1,852 | $184,952 | $42,886 | $142,066 |
| 2022 | $1,838 | $181,327 | $42,046 | $139,281 |
| 2021 | $1,763 | $177,772 | $41,222 | $136,550 |
| 2020 | $1,799 | $175,950 | $40,800 | $135,150 |
| 2019 | $904 | $82,437 | $26,760 | $55,677 |
| 2018 | $837 | $80,822 | $26,236 | $54,586 |
| 2017 | $844 | $79,238 | $25,722 | $53,516 |
| 2016 | $789 | $77,685 | $25,218 | $52,467 |
| 2015 | -- | $76,519 | $24,840 | $51,679 |
| 2014 | $765 | $75,021 | $24,354 | $50,667 |
Source: Public Records
Map
Nearby Homes
- 910 Aloha St
- 224 S Jackson St
- 845 Olive St
- 1270 Aloha St
- 406 S Jackson St
- 1160 Orange St
- 1307 Deborah Dr
- 425 S Jackson St
- 660 Villa Dr
- 728 Lincoln St
- 1210 Wetter Way
- 524 Madison St
- 532 Madison St
- 541 Jefferson St
- 1455 Acacia St
- 1212 S Jackson St
- 927 Cedar St
- 0 Jefferson St Unit SN26036140
- 1480 Leonard Ln
- 1235 Britt Ln
Your Personal Tour Guide
Ask me questions while you tour the home.