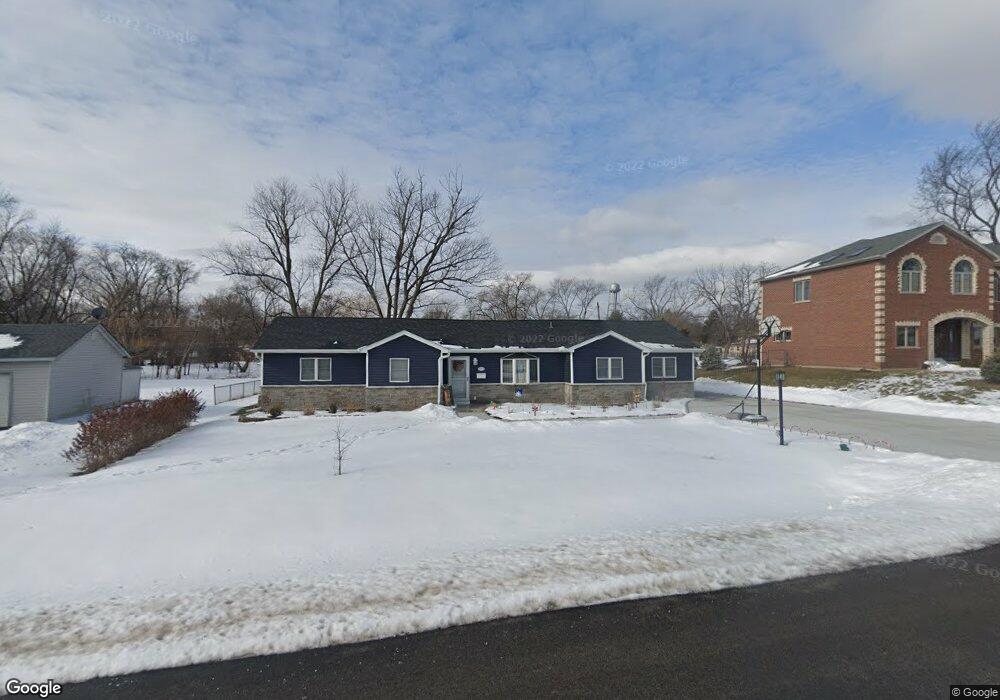
1070 N Bluebonnet Ln Hoffman Estates, IL 60169
Woodfield NeighborhoodEstimated Value: $380,594 - $462,000
3
Beds
2
Baths
1,465
Sq Ft
$289/Sq Ft
Est. Value
About This Home
This home is located at 1070 N Bluebonnet Ln, Hoffman Estates, IL 60169 and is currently estimated at $423,899, approximately $289 per square foot. 1070 N Bluebonnet Ln is a home located in Cook County with nearby schools including Fairview Elementary School, Helen Keller Junior High School, and J B Conant High School.
Ownership History
Date
Name
Owned For
Owner Type
Purchase Details
Closed on
Dec 11, 2017
Sold by
Bolbot Joseph A and Bolbot Adrienne C
Bought by
Bolbot Joseph A and Bolbot Adrienne C
Current Estimated Value
Purchase Details
Closed on
Aug 25, 2000
Sold by
Randazzo Joseph and Randazzo Deborah J
Bought by
Sahgal Sanatan and Sahgal Savita
Home Financials for this Owner
Home Financials are based on the most recent Mortgage that was taken out on this home.
Original Mortgage
$184,000
Outstanding Balance
$67,821
Interest Rate
8.26%
Estimated Equity
$356,078
Purchase Details
Closed on
Dec 18, 1998
Sold by
Randazzo Joseph
Bought by
Randazzo Joseph and Randazzo Deborah J
Home Financials for this Owner
Home Financials are based on the most recent Mortgage that was taken out on this home.
Original Mortgage
$173,000
Interest Rate
6.75%
Purchase Details
Closed on
Sep 22, 1995
Sold by
Markus Peter J and Markus Susan M
Bought by
Randazzo Joseph
Home Financials for this Owner
Home Financials are based on the most recent Mortgage that was taken out on this home.
Original Mortgage
$115,000
Interest Rate
8%
Create a Home Valuation Report for This Property
The Home Valuation Report is an in-depth analysis detailing your home's value as well as a comparison with similar homes in the area
Home Values in the Area
Average Home Value in this Area
Purchase History
| Date | Buyer | Sale Price | Title Company |
|---|---|---|---|
| Bolbot Joseph A | -- | Attorney | |
| Sahgal Sanatan | $230,000 | -- | |
| Randazzo Joseph | -- | -- | |
| Randazzo Joseph | $151,000 | -- |
Source: Public Records
Mortgage History
| Date | Status | Borrower | Loan Amount |
|---|---|---|---|
| Open | Sahgal Sanatan | $184,000 | |
| Previous Owner | Randazzo Joseph | $173,000 | |
| Previous Owner | Randazzo Joseph | $115,000 |
Source: Public Records
Tax History Compared to Growth
Tax History
| Year | Tax Paid | Tax Assessment Tax Assessment Total Assessment is a certain percentage of the fair market value that is determined by local assessors to be the total taxable value of land and additions on the property. | Land | Improvement |
|---|---|---|---|---|
| 2024 | $6,454 | $27,000 | $8,166 | $18,834 |
| 2023 | $6,190 | $27,000 | $8,166 | $18,834 |
| 2022 | $6,190 | $27,000 | $8,166 | $18,834 |
| 2021 | $4,899 | $20,616 | $8,676 | $11,940 |
| 2020 | $4,919 | $20,616 | $8,676 | $11,940 |
| 2019 | $4,974 | $23,164 | $8,676 | $14,488 |
| 2018 | $5,541 | $20,429 | $7,655 | $12,774 |
| 2017 | $5,462 | $20,429 | $7,655 | $12,774 |
| 2016 | $5,342 | $20,429 | $7,655 | $12,774 |
| 2015 | $4,811 | $17,603 | $6,634 | $10,969 |
| 2014 | $4,743 | $17,603 | $6,634 | $10,969 |
| 2013 | $4,604 | $17,603 | $6,634 | $10,969 |
Source: Public Records
Map
Nearby Homes
- 1180 Apple St
- 1190 Apple St
- 705 Ash Rd
- 465 Apache Ln
- 700 Cumberland St
- 845 Dracut Ln
- 800 Linden Cir
- 100 Des Plaines Ln
- 989 Butter Creek Ct Unit 3NE
- 363 Oaktree Ct
- 365 Juniper Tree Ct
- 100 White Oak Ct Unit 3
- 370 Flagstaff Ln
- 325 Bayview Point Unit 56B
- 1345 Jefferson Rd
- 2 Kristin Cir Unit 7
- 75 Kristin Cir Unit 315
- 75 Kristin Cir Unit 310
- 75 Kristin Cir Unit 503
- 751 Edgelake Point Unit 68C
- 1080 N Bluebonnet Ln
- 1060 N Bluebonnet Ln
- 1100 N Bluebonnet Ln
- 1085 Apricot St
- 240 Carnation Ln
- 270 Carnation Ln
- 1065 Apricot St
- 1075 N Bluebonnet Ln
- 1075 Apricot St
- 220 Carnation Ln
- 1085 N Bluebonnet Ln
- 1120 N Bluebonnet Ln
- 1105 N Bluebonnet Ln
- 1125 Apricot St
- 1045 Apricot St
- 1140 N Bluebonnet Ln
- 1125 N Bluebonnet Ln
- 1035 N Bluebonnet Ln
- 1145 Apricot St
- 265 Carnation Ln