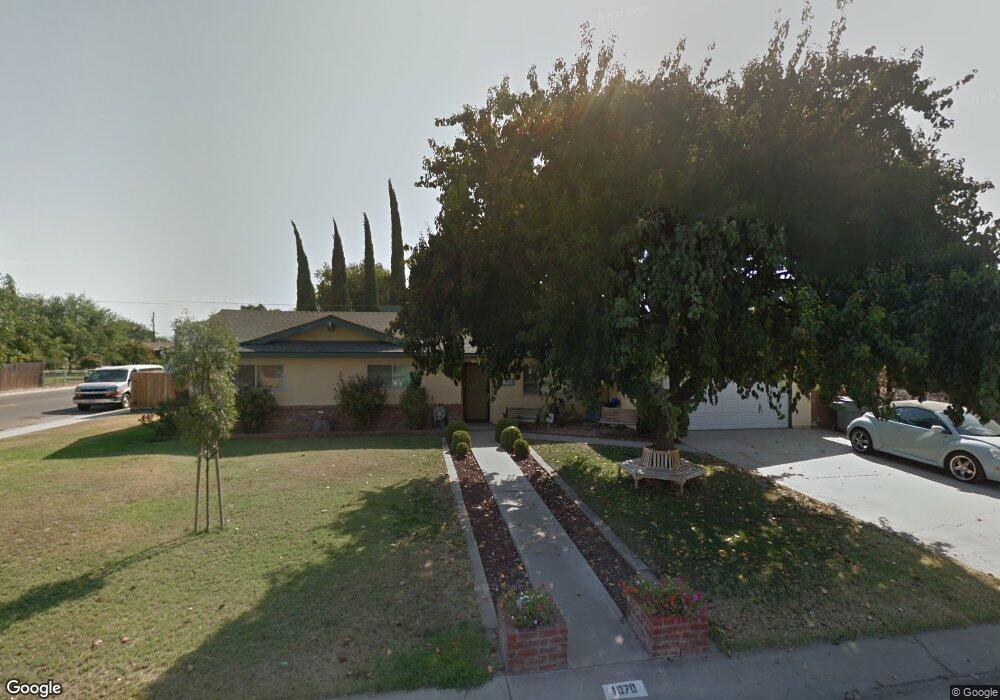
1070 N Euclid Ave Dinuba, CA 93618
Estimated Value: $333,000 - $370,000
3
Beds
2
Baths
1,480
Sq Ft
$233/Sq Ft
Est. Value
About This Home
This home is located at 1070 N Euclid Ave, Dinuba, CA 93618 and is currently estimated at $344,885, approximately $233 per square foot. 1070 N Euclid Ave is a home located in Tulare County with nearby schools including Roosevelt Elementary School, Washington Intermediate School, and Dinuba High School.
Ownership History
Date
Name
Owned For
Owner Type
Purchase Details
Closed on
Jan 31, 2001
Sold by
Hernandez Ismael
Bought by
Shouse Donald and Shouse Cindy
Current Estimated Value
Home Financials for this Owner
Home Financials are based on the most recent Mortgage that was taken out on this home.
Original Mortgage
$96,900
Interest Rate
7.19%
Mortgage Type
VA
Purchase Details
Closed on
Oct 1, 1998
Sold by
Mcillwain Tommy D
Bought by
Hernandez Ismael and Hernandez Miley
Home Financials for this Owner
Home Financials are based on the most recent Mortgage that was taken out on this home.
Original Mortgage
$68,250
Interest Rate
10.37%
Purchase Details
Closed on
Oct 31, 1994
Sold by
Va
Bought by
Mcillwain Tommy D and Mcillwain Sandra L
Create a Home Valuation Report for This Property
The Home Valuation Report is an in-depth analysis detailing your home's value as well as a comparison with similar homes in the area
Home Values in the Area
Average Home Value in this Area
Purchase History
| Date | Buyer | Sale Price | Title Company |
|---|---|---|---|
| Shouse Donald | $95,000 | Cuesta Title Company | |
| Hernandez Ismael | $105,000 | Chicago Title Co | |
| Mcillwain Tommy D | -- | -- |
Source: Public Records
Mortgage History
| Date | Status | Borrower | Loan Amount |
|---|---|---|---|
| Previous Owner | Shouse Donald | $96,900 | |
| Previous Owner | Hernandez Ismael | $68,250 | |
| Closed | Hernandez Ismael | $36,750 |
Source: Public Records
Tax History Compared to Growth
Tax History
| Year | Tax Paid | Tax Assessment Tax Assessment Total Assessment is a certain percentage of the fair market value that is determined by local assessors to be the total taxable value of land and additions on the property. | Land | Improvement |
|---|---|---|---|---|
| 2025 | $1,572 | $143,155 | $39,179 | $103,976 |
| 2024 | $1,572 | $140,349 | $38,411 | $101,938 |
| 2023 | $1,559 | $137,598 | $37,658 | $99,940 |
| 2022 | $1,483 | $134,901 | $36,920 | $97,981 |
| 2021 | $1,451 | $132,256 | $36,196 | $96,060 |
| 2020 | $1,467 | $130,900 | $35,825 | $95,075 |
| 2019 | $1,496 | $128,334 | $35,123 | $93,211 |
| 2018 | $1,438 | $125,817 | $34,434 | $91,383 |
| 2017 | $1,439 | $123,350 | $33,759 | $89,591 |
| 2016 | $1,365 | $120,931 | $33,097 | $87,834 |
| 2015 | $1,300 | $119,115 | $32,600 | $86,515 |
| 2014 | $1,300 | $116,781 | $31,961 | $84,820 |
Source: Public Records
Map
Nearby Homes
- 1177 Timothy Ave
- 1401 N Nichols Ave
- 976 Daisy Ct
- 616 W Bloomingdale Ave
- 371 Village Dr
- 1237 Chestnut Ln
- 375 Amber Ln
- 397 Amber Ln
- 784/784a N Lillie Ave
- 1306 Country Place
- 1266 N Skye St Unit Mb90
- 605 E Davis Dr
- 0 Road 80
- 1007 Ruby Ln Unit Lt 53
- 785 E Saginaw Ave
- 789 E Millwood Dr
- 0 Avenue 424
- 1513 Crimson Way Unit Lot 4
- 1484 Concord Way Unit Lt 37
- 1484 Concord Way Unit Lot 37
- 1046 N Euclid Ave
- 459 Lindera Ave
- 1053 Cara Rd
- 1120 N Euclid Ave
- 1121 Cara Rd
- 1022 N Euclid Ave
- 1027 Cara Rd
- 1055 N Euclid Ave
- 1146 N Euclid Ave
- 1119 N Euclid Ave
- 1078 Cara Rd
- 1145 Cara Rd
- 1007 Cara Rd
- 1052 Cara Rd
- 990 N Euclid Ave
- 1122 Cara Rd
- 1026 Cara Rd
- 1023 N Euclid Ave
- 1172 N Euclid Ave
- 981 Cara Rd