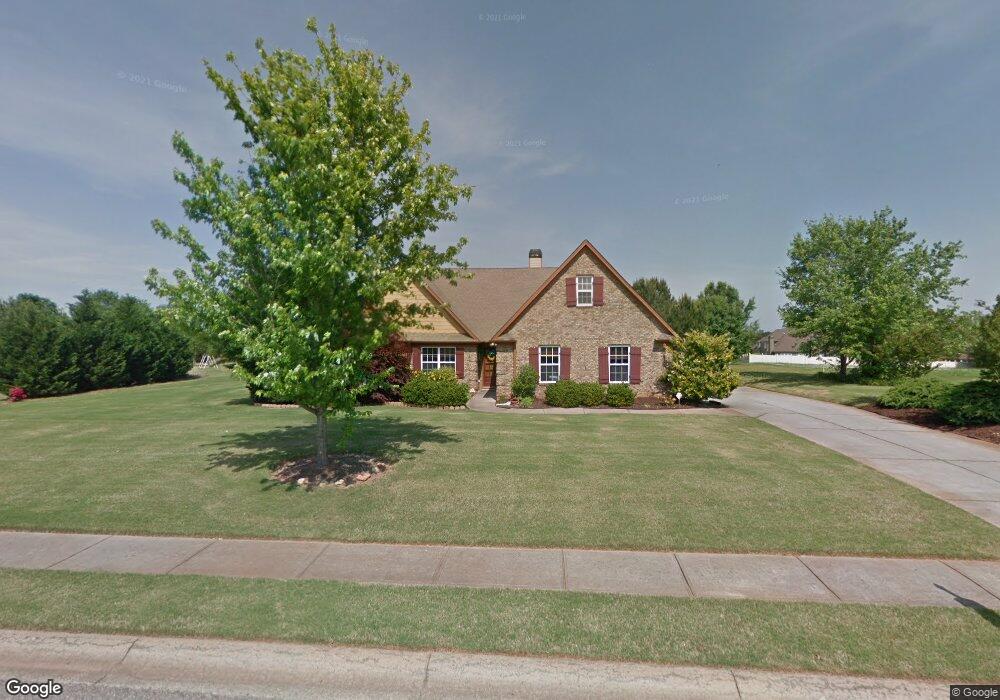
1070 Ruby Way Bogart, GA 30622
Estimated Value: $549,327 - $633,000
3
Beds
3
Baths
2,622
Sq Ft
$224/Sq Ft
Est. Value
About This Home
This home is located at 1070 Ruby Way, Bogart, GA 30622 and is currently estimated at $588,582, approximately $224 per square foot. 1070 Ruby Way is a home located in Oconee County with nearby schools including Rocky Branch Elementary School, Malcom Bridge Middle School, and North Oconee High School.
Ownership History
Date
Name
Owned For
Owner Type
Purchase Details
Closed on
Jan 28, 2009
Sold by
Crm Central Properties Llc
Bought by
Patel Nilay G
Current Estimated Value
Home Financials for this Owner
Home Financials are based on the most recent Mortgage that was taken out on this home.
Original Mortgage
$170,000
Outstanding Balance
$105,468
Interest Rate
5.08%
Mortgage Type
New Conventional
Estimated Equity
$483,114
Purchase Details
Closed on
Nov 4, 2008
Sold by
Kendall Homes Inc
Bought by
Crm Central Properties Llc
Purchase Details
Closed on
Dec 29, 2006
Sold by
Oconee Building Partners Llc
Bought by
Kendall Homes Inc
Purchase Details
Closed on
Jun 29, 2005
Sold by
Powerhouse Custom Homes Inc
Bought by
Oconee Building Partners Llc
Purchase Details
Closed on
May 9, 2005
Sold by
Starke V Hudson Trustee
Bought by
Powerhouse Custom Homes Inc
Create a Home Valuation Report for This Property
The Home Valuation Report is an in-depth analysis detailing your home's value as well as a comparison with similar homes in the area
Purchase History
| Date | Buyer | Sale Price | Title Company |
|---|---|---|---|
| Patel Nilay G | $212,500 | -- | |
| Crm Central Properties Llc | $240,000 | -- | |
| Kendall Homes Inc | $425,000 | -- | |
| Oconee Building Partners Llc | -- | -- | |
| Powerhouse Custom Homes Inc | $1,275,000 | -- |
Source: Public Records
Mortgage History
| Date | Status | Borrower | Loan Amount |
|---|---|---|---|
| Open | Patel Nilay G | $170,000 |
Source: Public Records
Tax History
| Year | Tax Paid | Tax Assessment Tax Assessment Total Assessment is a certain percentage of the fair market value that is determined by local assessors to be the total taxable value of land and additions on the property. | Land | Improvement |
|---|---|---|---|---|
| 2025 | $3,286 | $185,496 | $36,000 | $149,496 |
| 2024 | $3,286 | $178,450 | $36,000 | $142,450 |
| 2023 | $3,338 | $164,935 | $30,000 | $134,935 |
| 2022 | $3,079 | $143,602 | $26,000 | $117,602 |
| 2021 | $2,893 | $125,216 | $20,000 | $105,216 |
| 2020 | $2,747 | $118,702 | $20,000 | $98,702 |
| 2019 | $2,604 | $112,559 | $20,000 | $92,559 |
| 2018 | $2,331 | $98,685 | $20,000 | $78,685 |
| 2017 | $2,295 | $97,165 | $20,000 | $77,165 |
| 2016 | $2,151 | $91,089 | $19,000 | $72,089 |
| 2015 | $1,975 | $83,473 | $19,000 | $64,473 |
| 2014 | $2,058 | $85,058 | $20,000 | $65,058 |
| 2013 | -- | $82,494 | $20,000 | $62,494 |
Source: Public Records
Map
Nearby Homes
- 1090 Ruby Way
- 1181 Pete Dickens Rd
- 1030 Diamond Way
- 1061 Cobblestone Ln
- 1060 Cobblestone Ln
- 1190 Cobblestone Ln
- 1090 Talus St
- 4100 Monroe Hwy
- 4400 Monroe Hwy Unit PARCEL 1-7
- 3240 Monroe Hwy
- 1000 Holcomb Ct
- 1542 Lenten Way
- 00 Ruth Jackson Rd
- 0 Ruth Jackson Rd Unit 10582108
- 1640 Madison Ct
- 1811 McNutt Creek Rd
- 1851 McNutt Creek Rd
- 1060 Fox Hollow Ct
- 2986 Coralbell Dr
- 2142 Eisenhower Ave
- 1050 Ruby Way
- 1080 Ruby Way
- 1030 Emerald Way
- 1100 Garnet Trail
- 1120 Garnet Trail
- 1030 Ruby Way
- 1080 Garnet Trail
- 1372 Blackstone Way
- 1090 Ruby Way Unit 7D
- 1130 Garnet Trail
- 1061 Ruby Way
- 1081 Ruby Way Unit 13C
- 1081 Ruby Way
- 1041 Ruby Way
- 1071 Ruby Way
- 1010 Ruby Way
- 1140 Garnet Trail
- 1070 Garnet Trail Unit 20D
- 1070 Garnet Trail
- 1091 Ruby Way Unit 12C
Your Personal Tour Guide
Ask me questions while you tour the home.