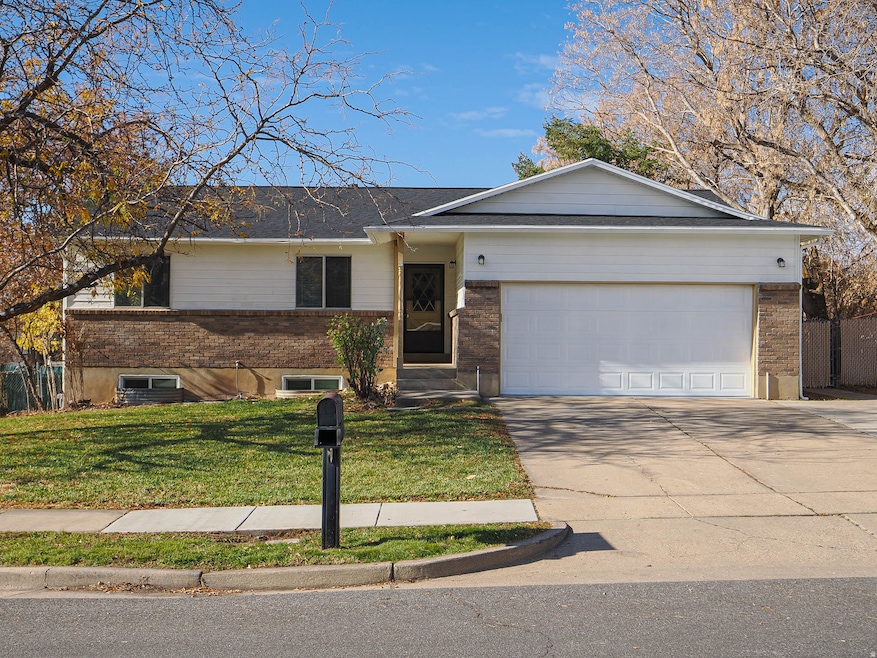
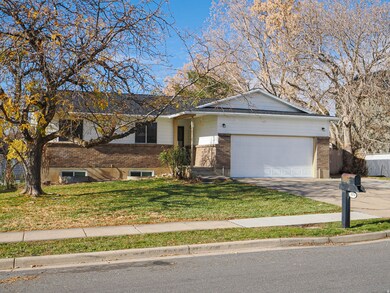
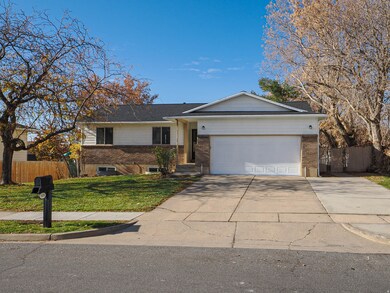
1070 S 1650 E Clearfield, UT 84015
Estimated payment $2,576/month
Highlights
- Updated Kitchen
- 1 Fireplace
- 2 Car Attached Garage
- Rambler Architecture
- No HOA
- Laundry Room
About This Home
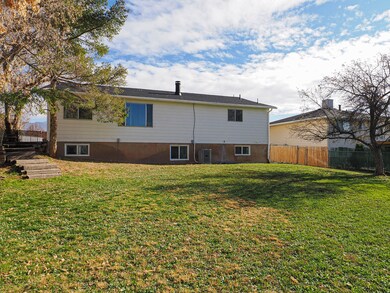
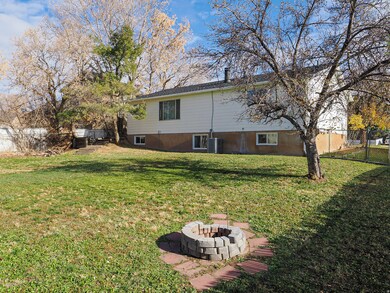
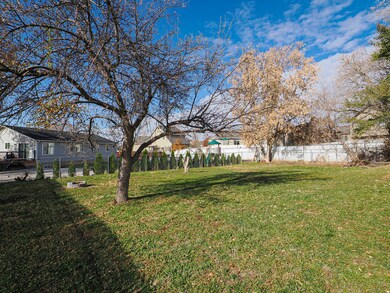
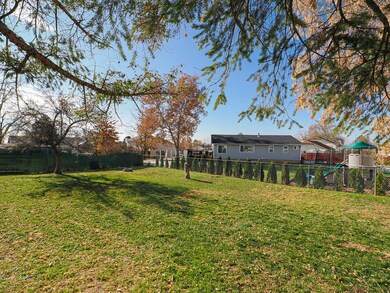
***OPEN HOUSE SATURDAY 11/29 10:00 AM TO 12:00 PM*** This stunning 6-bedroom, 3-bath rambler has been completely remodeled from top to bottom. Enjoy modern living with brand-new paint, carpet, LVP flooring, kitchen cabinets and countertops, bathroom vanities, toilets, lighting, central air, water heaters, roof, epoxy flooring in the garage, newer appliances, plumbing updates and more, delivering both style and peace of mind. The open main level features a spacious living room that flows seamlessly into the dining area and kitchen, along with two additional bedrooms and a private primary suite complete with a 3/4 bathroom. Downstairs, the finished basement offers three more bedrooms, a full bathroom, a laundry room, and a massive family room, perfect for entertaining, movie nights, or hosting gatherings. The light and inviting main level pairs beautifully with the flexible lower level, creating ideal spaces for working from home, relaxing, or large get-togethers. Step outside to enjoy the fully landscaped, private backyard with full sprinklers and mature trees, ideal for summer evenings, kids, pets, and future possibilities. The seller is willing to entertain any and all requests in an offer AGENTS - READ AGENT REMARKS
Open House Schedule
-
Saturday, November 29, 202510:00 am to 12:00 pm11/29/2025 10:00:00 AM +00:0011/29/2025 12:00:00 PM +00:00Add to Calendar
Home Details
Home Type
- Single Family
Est. Annual Taxes
- $2,387
Year Built
- Built in 1978
Lot Details
- 10,454 Sq Ft Lot
- Property is Fully Fenced
- Landscaped
- Sprinkler System
- Property is zoned Single-Family
Parking
- 2 Car Attached Garage
Home Design
- Rambler Architecture
- Brick Exterior Construction
Interior Spaces
- 2,452 Sq Ft Home
- 2-Story Property
- 1 Fireplace
- Basement Fills Entire Space Under The House
- Laundry Room
Kitchen
- Updated Kitchen
- Free-Standing Range
- Microwave
- Disposal
Flooring
- Carpet
- Tile
Bedrooms and Bathrooms
- 6 Bedrooms | 3 Main Level Bedrooms
Schools
- Holt Elementary School
- North Davis Middle School
- Clearfield High School
Utilities
- Forced Air Heating and Cooling System
- Natural Gas Connected
Community Details
- No Home Owners Association
Listing and Financial Details
- Assessor Parcel Number 09-033-0015
Map
Home Values in the Area
Average Home Value in this Area
Tax History
| Year | Tax Paid | Tax Assessment Tax Assessment Total Assessment is a certain percentage of the fair market value that is determined by local assessors to be the total taxable value of land and additions on the property. | Land | Improvement |
|---|---|---|---|---|
| 2025 | $2,387 | $213,950 | $80,862 | $133,088 |
| 2024 | $2,120 | $191,400 | $77,242 | $114,158 |
| 2023 | $1,962 | $178,750 | $67,492 | $111,257 |
| 2022 | $2,007 | $327,000 | $126,420 | $200,580 |
| 2021 | $1,920 | $260,000 | $78,417 | $181,583 |
| 2020 | $1,666 | $224,000 | $66,833 | $157,167 |
| 2019 | $1,612 | $214,000 | $66,829 | $147,171 |
| 2018 | $1,485 | $192,000 | $56,352 | $135,648 |
| 2016 | $1,278 | $86,405 | $24,001 | $62,404 |
| 2015 | $1,150 | $74,140 | $24,001 | $50,139 |
| 2014 | $1,336 | $87,276 | $24,001 | $63,275 |
| 2013 | -- | $65,883 | $26,367 | $39,516 |
Property History
| Date | Event | Price | List to Sale | Price per Sq Ft |
|---|---|---|---|---|
| 11/26/2025 11/26/25 | For Sale | $450,000 | -- | $184 / Sq Ft |
Purchase History
| Date | Type | Sale Price | Title Company |
|---|---|---|---|
| Warranty Deed | -- | Equity Title Ins Agency Inc | |
| Interfamily Deed Transfer | -- | -- | |
| Warranty Deed | -- | Equity Title Agency |
Mortgage History
| Date | Status | Loan Amount | Loan Type |
|---|---|---|---|
| Open | $112,000 | Fannie Mae Freddie Mac | |
| Previous Owner | $122,022 | FHA |
Source: UtahRealEstate.com
MLS Number: 2124650
APN: 09-033-0015
Disclaimer: Certain information contained herein is derived from information provided by parties other than Homes.com. All information provided is deemed reliable, but is not guaranteed to be accurate and should be independently verified.
![]() IDX information is provided exclusively for consumers’ personal, non-commercial use, that it may not be used for any purpose other than to identify prospective properties consumers may be interested in purchasing, and that the data is deemed reliable but is not guaranteed accurate by the MLS. Licensor is only providing the MLS Content and not other sources of data provided in the Product.
IDX information is provided exclusively for consumers’ personal, non-commercial use, that it may not be used for any purpose other than to identify prospective properties consumers may be interested in purchasing, and that the data is deemed reliable but is not guaranteed accurate by the MLS. Licensor is only providing the MLS Content and not other sources of data provided in the Product.
Based on information from the Wasatch Front Regional Multiple Listing Service, Inc.. All data, including all measurements and calculations of area, is obtained from various sources and has not been, and will not be, verified by broker or the MLS. All information should be independently reviewed and verified for accuracy. Properties may or may not be listed by the office/agent presenting the information.
- 1548 E 925 S
- 1660 E 900 S Unit 18
- 1542 E 925 S
- 870 S 1625 E Unit 26 D
- 865 S 1650 E Unit A
- 2887 N 1175 W
- 2949 N 1175 W
- 2298 N 1085 W
- 1155 W 2200 N
- 1234 S 1050 E
- 1021 E 1225 S Unit A
- 1606 W 1960 N
- 1574 W 1920 N
- 1596 N Main St Unit 2
- 897 E 1000 S
- 2402 N 725 W
- 709 W Highway 193
- 1748 N 1600 W
- 1740 N 1600 W Unit 116
- 1992 W Afton Cir
