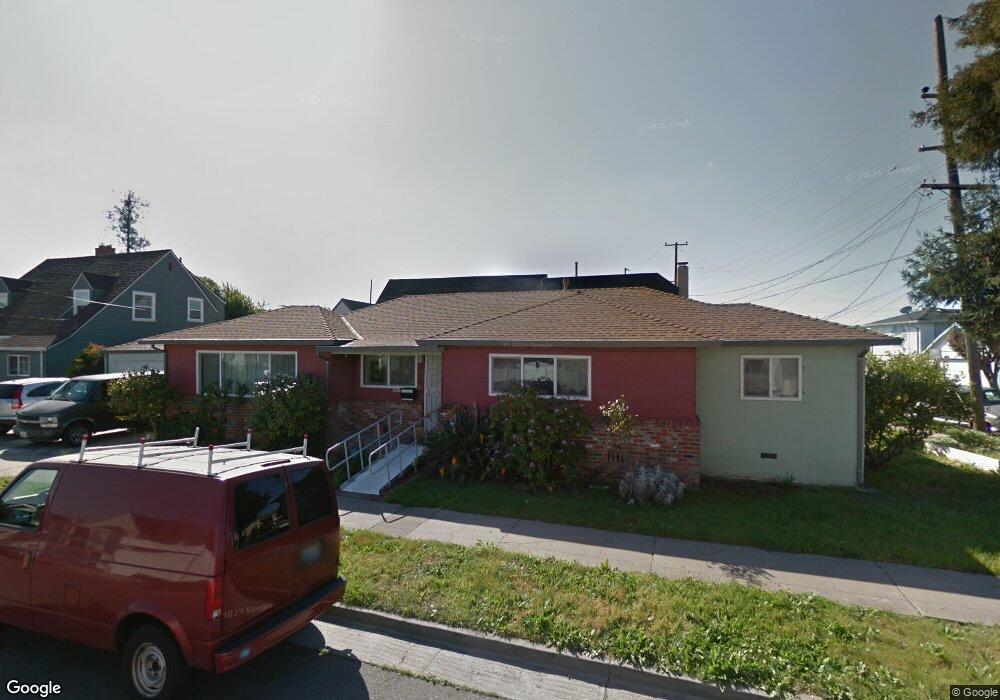
10700 Beverly Ave Oakland, CA 94603
Durant Manor NeighborhoodEstimated Value: $637,000 - $758,000
3
Beds
2
Baths
1,513
Sq Ft
$463/Sq Ft
Est. Value
About This Home
This home is located at 10700 Beverly Ave, Oakland, CA 94603 and is currently estimated at $700,835, approximately $463 per square foot. 10700 Beverly Ave is a home located in Alameda County with nearby schools including Reach Academy, Elmhurst United Middle School, and Madison Park Academy (6-12).
Ownership History
Date
Name
Owned For
Owner Type
Purchase Details
Closed on
Mar 13, 2008
Sold by
Fremont Investment & Loan
Bought by
Lincer David M and Lincer Joan E
Current Estimated Value
Home Financials for this Owner
Home Financials are based on the most recent Mortgage that was taken out on this home.
Original Mortgage
$199,500
Outstanding Balance
$125,944
Interest Rate
5.99%
Mortgage Type
Purchase Money Mortgage
Estimated Equity
$574,891
Purchase Details
Closed on
Mar 22, 2007
Sold by
Simpson Clifton L and Simpson Sharon
Bought by
Fremont Investment & Loan
Purchase Details
Closed on
Mar 6, 2007
Sold by
Simpson Clifton L and Simpson Sharon
Bought by
Simpson Clifton L and Simpson Sharon
Purchase Details
Closed on
Jul 10, 1997
Sold by
Simpson Sharon D
Bought by
Simpson Clifton L
Home Financials for this Owner
Home Financials are based on the most recent Mortgage that was taken out on this home.
Original Mortgage
$122,400
Interest Rate
7.34%
Mortgage Type
VA
Create a Home Valuation Report for This Property
The Home Valuation Report is an in-depth analysis detailing your home's value as well as a comparison with similar homes in the area
Home Values in the Area
Average Home Value in this Area
Purchase History
| Date | Buyer | Sale Price | Title Company |
|---|---|---|---|
| Lincer David M | $300,000 | First American Title Company | |
| Fremont Investment & Loan | $426,690 | Accommodation | |
| Simpson Clifton L | -- | None Available | |
| Simpson Clifton L | -- | Old Republic Title Company | |
| Simpson Clifton L | $122,500 | -- |
Source: Public Records
Mortgage History
| Date | Status | Borrower | Loan Amount |
|---|---|---|---|
| Open | Lincer David M | $199,500 | |
| Previous Owner | Simpson Clifton L | $122,400 |
Source: Public Records
Tax History
| Year | Tax Paid | Tax Assessment Tax Assessment Total Assessment is a certain percentage of the fair market value that is determined by local assessors to be the total taxable value of land and additions on the property. | Land | Improvement |
|---|---|---|---|---|
| 2025 | $6,629 | $387,028 | $118,208 | $275,820 |
| 2024 | $6,629 | $379,303 | $115,891 | $270,412 |
| 2023 | $6,899 | $378,731 | $113,619 | $265,112 |
| 2022 | $6,684 | $364,306 | $111,392 | $259,914 |
| 2021 | $6,322 | $357,028 | $109,208 | $254,820 |
| 2020 | $6,251 | $360,296 | $108,089 | $252,207 |
| 2019 | $5,972 | $353,234 | $105,970 | $247,264 |
| 2018 | $5,849 | $346,310 | $103,893 | $242,417 |
| 2017 | $5,609 | $339,521 | $101,856 | $237,665 |
| 2016 | $5,382 | $332,864 | $99,859 | $233,005 |
| 2015 | $5,351 | $327,866 | $98,360 | $229,506 |
| 2014 | $4,577 | $255,000 | $76,500 | $178,500 |
Source: Public Records
Map
Nearby Homes
- 2139 108th Ave
- 2174 107th Ave
- 2050 102nd Ave
- 1622 Tucker St Unit 66
- 10315 Dante Ave
- 10926 Bancroft Ave
- 1594 Tucker St Unit 56
- 2125 102nd Ave
- 1941 101st Ave
- 10504 Voltaire Ave
- 10430 Voltaire Ave
- 2220 100th Ave
- 1627 104th Ave
- 9953 Dante Ave
- 1636 101st Ave
- 9923 Birch St
- 10329 Macarthur Blvd
- 9425 Sunnyside St
- 1362 104th Ave
- 1332 103rd Ave
- 10706 Beverly Ave
- 2016 107th Ave
- 10714 Beverly Ave
- 10626 Beverly Ave
- 2024 107th Ave
- 1950 107th Ave
- 10720 Beverly Ave
- 2017 107th Ave
- 10620 Beverly Ave
- 2023 107th Ave
- 2030 107th Ave
- 1945 108th Ave
- 10726 Beverly Ave
- 1944 107th Ave
- 2017 108th Ave
- 10614 Beverly Ave
- 2029 107th Ave
- 10619 Beverly Ave
- 1939 108th Ave
- 2036 107th Ave
Your Personal Tour Guide
Ask me questions while you tour the home.