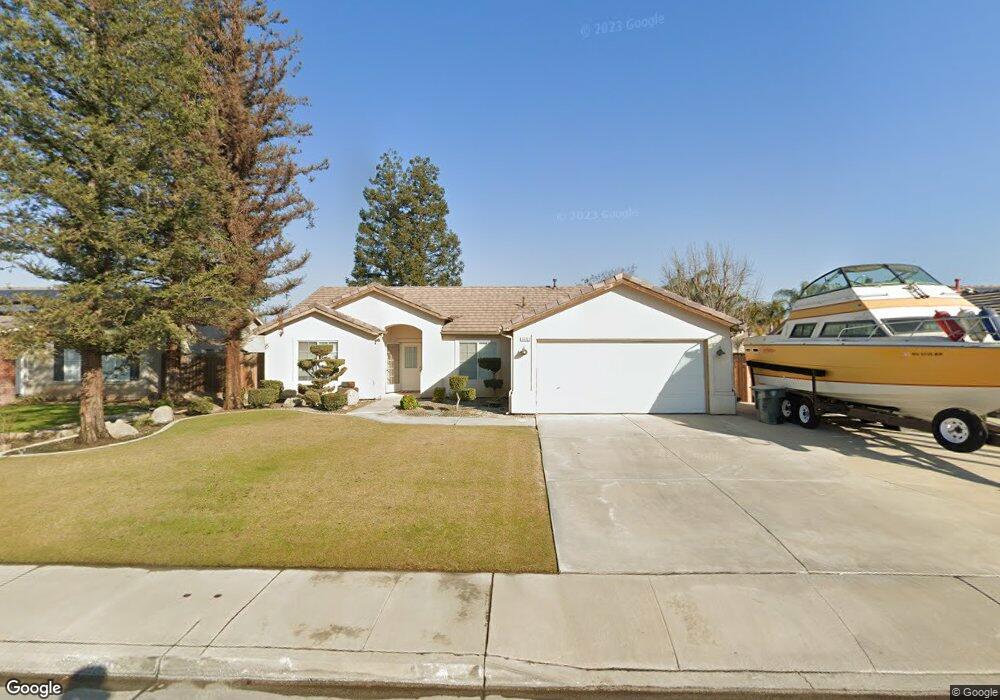
10702 Falling Springs Ave Unit 3 Bakersfield, CA 93312
Crystal Ranch NeighborhoodEstimated Value: $405,500 - $446,000
3
Beds
2
Baths
1,638
Sq Ft
$260/Sq Ft
Est. Value
About This Home
This home is located at 10702 Falling Springs Ave Unit 3, Bakersfield, CA 93312 and is currently estimated at $426,375, approximately $260 per square foot. 10702 Falling Springs Ave Unit 3 is a home located in Kern County with nearby schools including Almondale Elementary School, Freedom Middle School, and Frontier High School.
Ownership History
Date
Name
Owned For
Owner Type
Purchase Details
Closed on
Jul 16, 2003
Sold by
Plemmons Keith M and Plemmons Wendi L
Bought by
Camper Scott J and Camper Diane L
Current Estimated Value
Home Financials for this Owner
Home Financials are based on the most recent Mortgage that was taken out on this home.
Original Mortgage
$80,000
Outstanding Balance
$34,882
Interest Rate
5.6%
Mortgage Type
Purchase Money Mortgage
Estimated Equity
$391,493
Purchase Details
Closed on
Jun 21, 2001
Sold by
Plemmons Keith M and Plemmons Keith
Bought by
Plemmons Keith M and Plemmons Wendi L
Home Financials for this Owner
Home Financials are based on the most recent Mortgage that was taken out on this home.
Original Mortgage
$126,135
Interest Rate
7.14%
Mortgage Type
VA
Purchase Details
Closed on
May 25, 1999
Sold by
Centex International Inc
Bought by
Plemmons Keith
Home Financials for this Owner
Home Financials are based on the most recent Mortgage that was taken out on this home.
Original Mortgage
$118,830
Interest Rate
7.01%
Mortgage Type
VA
Create a Home Valuation Report for This Property
The Home Valuation Report is an in-depth analysis detailing your home's value as well as a comparison with similar homes in the area
Home Values in the Area
Average Home Value in this Area
Purchase History
| Date | Buyer | Sale Price | Title Company |
|---|---|---|---|
| Camper Scott J | $182,000 | -- | |
| Plemmons Keith M | -- | Commonwealth Land Title Co | |
| Plemmons Keith | $116,500 | Stewart Title |
Source: Public Records
Mortgage History
| Date | Status | Borrower | Loan Amount |
|---|---|---|---|
| Open | Camper Scott J | $80,000 | |
| Previous Owner | Plemmons Keith M | $126,135 | |
| Previous Owner | Plemmons Keith | $118,830 |
Source: Public Records
Tax History Compared to Growth
Tax History
| Year | Tax Paid | Tax Assessment Tax Assessment Total Assessment is a certain percentage of the fair market value that is determined by local assessors to be the total taxable value of land and additions on the property. | Land | Improvement |
|---|---|---|---|---|
| 2025 | $4,353 | $258,742 | $49,752 | $208,990 |
| 2024 | $4,267 | $253,670 | $48,777 | $204,893 |
| 2023 | $4,267 | $248,697 | $47,821 | $200,876 |
| 2022 | $4,186 | $243,822 | $46,884 | $196,938 |
| 2021 | $4,045 | $239,042 | $45,965 | $193,077 |
| 2020 | $4,009 | $236,592 | $45,494 | $191,098 |
| 2019 | $3,878 | $236,592 | $45,494 | $191,098 |
| 2018 | $3,813 | $227,406 | $43,728 | $183,678 |
| 2017 | $3,770 | $222,948 | $42,871 | $180,077 |
| 2016 | $3,548 | $218,578 | $42,031 | $176,547 |
| 2015 | $3,493 | $215,296 | $41,400 | $173,896 |
| 2014 | $3,420 | $211,080 | $40,590 | $170,490 |
Source: Public Records
Map
Nearby Homes
- 5605 Meadow Valley Ct Unit 3
- 5903 Pendleton Falls Dr
- 5504 Danbury Ct
- 10814 Gustavo Ct
- 10815 Dapple Way
- 10718 Pinebrook Falls Dr
- 10302 Willow Bend Ct
- 10716 Brandywine Falls Ave Unit 7
- 10131 Seven Falls Ave
- 10407 Arapaho Ave
- 5102 Swaps Ct
- 10707 Mohican Dr
- 10201 Iroquois Ln
- 11106 Mohican Dr
- 11313 Andretti Ave
- 11018 Sonoma Creek Ct
- 11417 Pacific Breeze Ave
- 11016 Bellfounder Dr
- 6307 San Rogue Ct
- 11424 Revolution Rd
- 10706 Falling Springs Ave
- 10608 Falling Springs Ave
- 10710 Falling Springs Ave
- 10703 Falling Springs Ave
- 10609 Falling Springs Ave
- 10600 Falling Springs Ave
- 10707 Falling Springs Ave
- 10714 Falling Springs Ave Unit 3
- 10601 Falling Springs Ave
- 10623 Yosemite Falls Ave Unit 2
- 10617 Yosemite Falls Ave
- 10800 Falling Springs Ave
- 10615 Yosemite Falls Ave Unit 2
- 5704 Charleville Ln
- 5801 Pendleton Falls Dr Unit 2
- 10715 Falling Springs Ave
- 10807 Lewelling St
- 10700 Wind Blossom Ave Unit 3
- 10604 Wind Blossom Ave Unit 3