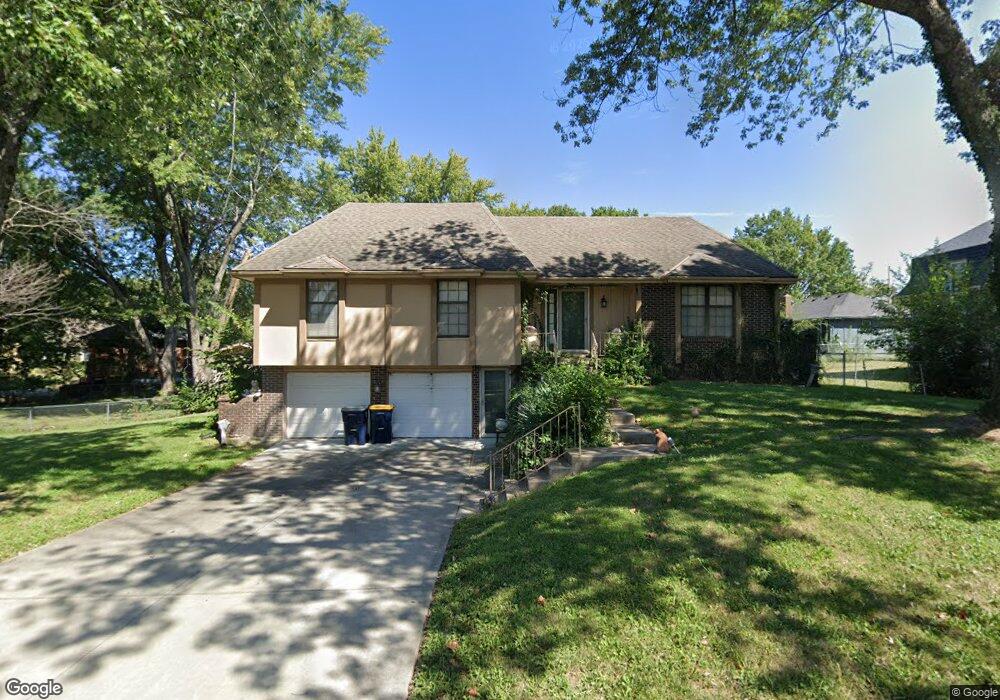
10708 E 95th Terrace Kansas City, MO 64134
Highview Estates NeighborhoodEstimated Value: $255,387 - $300,000
3
Beds
3
Baths
1,554
Sq Ft
$180/Sq Ft
Est. Value
About This Home
This home is located at 10708 E 95th Terrace, Kansas City, MO 64134 and is currently estimated at $279,847, approximately $180 per square foot. 10708 E 95th Terrace is a home located in Jackson County with nearby schools including Truman Elementary School, St Regis School, and Islamic School of Greater Kansas City.
Ownership History
Date
Name
Owned For
Owner Type
Purchase Details
Closed on
Jul 21, 2011
Sold by
Adg Properties Llc
Bought by
Handie Tamela
Current Estimated Value
Home Financials for this Owner
Home Financials are based on the most recent Mortgage that was taken out on this home.
Original Mortgage
$128,653
Outstanding Balance
$87,415
Interest Rate
4.25%
Mortgage Type
FHA
Estimated Equity
$192,432
Purchase Details
Closed on
Jan 5, 2011
Sold by
Mortgage One Corporation
Bought by
Adg Properties Llc
Purchase Details
Closed on
Aug 3, 2010
Sold by
Jones Beverly A
Bought by
Mortgage One Corporation and Hfc Mortgage Corporation
Purchase Details
Closed on
Nov 16, 1999
Bought by
Jones Beverly A
Home Financials for this Owner
Home Financials are based on the most recent Mortgage that was taken out on this home.
Original Mortgage
$99,655
Interest Rate
7.73%
Mortgage Type
New Conventional
Create a Home Valuation Report for This Property
The Home Valuation Report is an in-depth analysis detailing your home's value as well as a comparison with similar homes in the area
Home Values in the Area
Average Home Value in this Area
Purchase History
| Date | Buyer | Sale Price | Title Company |
|---|---|---|---|
| Handie Tamela | -- | Alpha Title Llc | |
| Adg Properties Llc | $54,000 | None Available | |
| Mortgage One Corporation | $76,707 | None Available | |
| Jones Beverly A | -- | -- |
Source: Public Records
Mortgage History
| Date | Status | Borrower | Loan Amount |
|---|---|---|---|
| Open | Handie Tamela | $128,653 | |
| Previous Owner | Jones Beverly A | $99,655 |
Source: Public Records
Tax History Compared to Growth
Tax History
| Year | Tax Paid | Tax Assessment Tax Assessment Total Assessment is a certain percentage of the fair market value that is determined by local assessors to be the total taxable value of land and additions on the property. | Land | Improvement |
|---|---|---|---|---|
| 2025 | $3,034 | $40,303 | $6,454 | $33,849 |
| 2024 | $2,979 | $35,047 | $3,745 | $31,302 |
| 2023 | $2,979 | $35,047 | $6,319 | $28,728 |
| 2022 | $3,180 | $32,110 | $6,451 | $25,659 |
| 2021 | $2,743 | $32,110 | $6,451 | $25,659 |
| 2020 | $2,631 | $29,120 | $6,451 | $22,669 |
| 2019 | $2,489 | $29,120 | $6,451 | $22,669 |
| 2018 | $2,169 | $23,702 | $3,432 | $20,270 |
| 2017 | $2,169 | $23,702 | $3,432 | $20,270 |
| 2016 | $2,156 | $22,878 | $4,374 | $18,504 |
| 2014 | $2,091 | $22,429 | $4,288 | $18,141 |
Source: Public Records
Map
Nearby Homes
- 10500 E Bannister Rd
- 9420 Ralston Ave
- 9721 Elm Ave
- 9425 E 90th Terrace
- 9525 Manning Ave
- 12200 E 89 Terrace
- 10401 View High Dr
- 8827 Larson Ave
- 8617 Evanston Ave
- 1031 NW Cedar Creek Ln
- 0 View High Dr Unit HMS2548973
- 8512 Maywood Ave
- 9109 E 89th St
- 10111 Lane Ave
- 11006 E 85th St
- 9616 E 86th Terrace
- 928 NW Cedar Creek Ln
- 8531 Vassar Ave
- 9901 E 85th St
- 8400 Willow Way
- 10718 E 95th Terrace
- 10709 E 95th Terrace
- 10700 E 95th Terrace
- 10701 E 95th Terrace
- 9514 View High Dr
- 10717 E 95th Terrace
- 10616 E 95th Terrace
- 10621 E 95th Terrace
- 9508 View High Dr
- 10612 E 95th Terrace
- 10604 E 95th Terrace
- 10608 E 95th Terrace
- 10615 E 95th Terrace
- 9600 View High Dr
- 10715 E Bannister Rd
- 10723 E Bannister Rd
- 10607 E 95th Terrace
- 10701 E Bannister Rd
- 10801 E Bannister Rd
- 9601 View High Dr