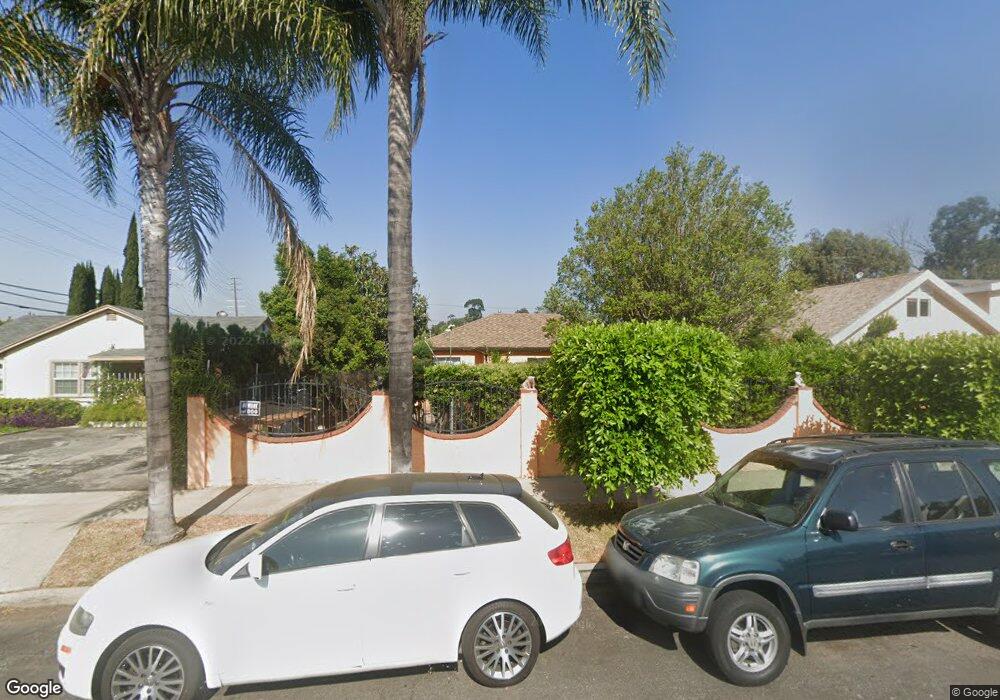
10709 Burnet Ave Mission Hills, CA 91345
Estimated Value: $942,152 - $1,140,000
6
Beds
4
Baths
2,824
Sq Ft
$373/Sq Ft
Est. Value
About This Home
This home is located at 10709 Burnet Ave, Mission Hills, CA 91345 and is currently estimated at $1,052,288, approximately $372 per square foot. 10709 Burnet Ave is a home located in Los Angeles County with nearby schools including San Jose Street Elementary School, George K. Porter Middle School, and John F. Kennedy High School.
Ownership History
Date
Name
Owned For
Owner Type
Purchase Details
Closed on
Jul 8, 2013
Sold by
Lopez Jesus A Loya
Bought by
Loya Jesus Alfredo and Loya Arcadia Eufemia
Current Estimated Value
Purchase Details
Closed on
Aug 19, 2003
Sold by
Lopez Jesus A Loya and Loya Arcadia E
Bought by
Lopez Jesus A Loya
Home Financials for this Owner
Home Financials are based on the most recent Mortgage that was taken out on this home.
Original Mortgage
$208,000
Interest Rate
5.6%
Mortgage Type
Purchase Money Mortgage
Purchase Details
Closed on
Jul 3, 1995
Sold by
Fuentes Jose Miguel Galindo and Coronado Guillermina Carrillo
Bought by
Lopez Jesus A Loya
Purchase Details
Closed on
Nov 29, 1994
Sold by
Shultz Doris T
Bought by
Lopez Jesus A Loya
Home Financials for this Owner
Home Financials are based on the most recent Mortgage that was taken out on this home.
Original Mortgage
$96,800
Interest Rate
9.27%
Create a Home Valuation Report for This Property
The Home Valuation Report is an in-depth analysis detailing your home's value as well as a comparison with similar homes in the area
Home Values in the Area
Average Home Value in this Area
Purchase History
| Date | Buyer | Sale Price | Title Company |
|---|---|---|---|
| Loya Jesus Alfredo | -- | None Available | |
| Lopez Jesus A Loya | -- | Stewart Title | |
| Lopez Jesus A Loya | -- | -- | |
| Lopez Jesus A Loya | $121,000 | Gateway Title |
Source: Public Records
Mortgage History
| Date | Status | Borrower | Loan Amount |
|---|---|---|---|
| Previous Owner | Lopez Jesus A Loya | $208,000 | |
| Previous Owner | Lopez Jesus A Loya | $96,800 |
Source: Public Records
Tax History Compared to Growth
Tax History
| Year | Tax Paid | Tax Assessment Tax Assessment Total Assessment is a certain percentage of the fair market value that is determined by local assessors to be the total taxable value of land and additions on the property. | Land | Improvement |
|---|---|---|---|---|
| 2025 | $5,238 | $399,851 | $101,822 | $298,029 |
| 2024 | $5,238 | $392,012 | $99,826 | $292,186 |
| 2023 | $5,145 | $384,326 | $97,869 | $286,457 |
| 2022 | $4,920 | $376,791 | $95,950 | $280,841 |
| 2021 | $4,848 | $369,404 | $94,069 | $275,335 |
| 2019 | $4,711 | $358,449 | $91,280 | $267,169 |
| 2018 | $4,518 | $351,422 | $89,491 | $261,931 |
| 2016 | $4,294 | $337,778 | $86,017 | $251,761 |
| 2015 | $4,235 | $332,705 | $84,725 | $247,980 |
| 2014 | $4,257 | $326,189 | $83,066 | $243,123 |
Source: Public Records
Map
Nearby Homes
- 10811 Columbus Ave Unit 26
- 18 Portola Rd
- 14947 Chatsworth St
- 14945 Chatsworth St
- 10959 Memory Park Ave
- 10956 Columbus Ave
- 10900 Sepulveda Blvd Unit 9
- 10900 Sepulveda Blvd Unit 1 Serra
- 10900 Sepulveda Blvd Unit 23
- 15018 Mankato St
- 15013 San Jose St
- 9 Donna Way
- 10864 Wolcott Place
- 2 Donna Way
- 10505 Langdon Ave
- 14909 Hiawatha St
- 10939 Langdon 167 Ave
- 10831 Orion Ave
- 14742 San Jose St
- 10828 Aqueduct Ave
- 10715 Burnet Ave
- 10703 Burnet Ave
- 15145 Chatsworth St
- 10727 Burnet Ave
- 10718 Memory Park Ave
- 10712 Memory Park Ave
- 10702 Burnet Ave
- 10710 Burnet Ave
- 10704 Memory Park Ave
- 10716 Burnet Ave
- 15198 Chatsworth St
- 10724 Burnet Ave
- 15210 Chatsworth St Unit A
- 15210 Chatsworth St Unit B
- 15210 Chatsworth St
- 15210 Chatsworth St
- 15051 Chatsworth Dr
- 10730 Burnet Ave
- 15208 Chatsworth St Unit B
- 15208 Chatsworth St