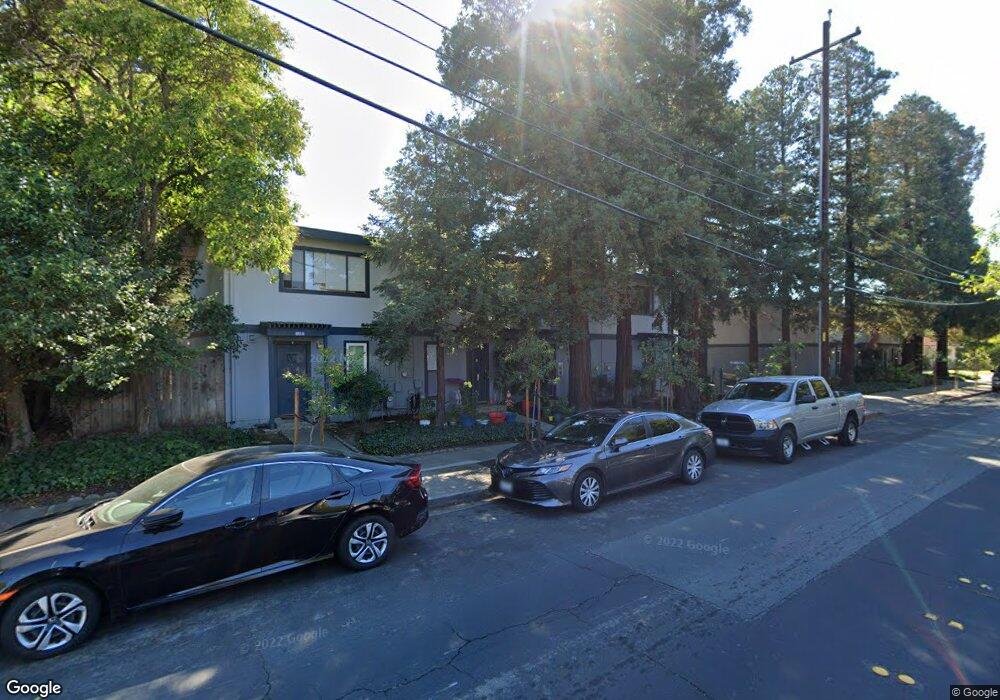
1071 Mohr Ln Unit C Concord, CA 94518
Tree Haven NeighborhoodEstimated Value: $327,000 - $399,818
2
Beds
2
Baths
1,088
Sq Ft
$347/Sq Ft
Est. Value
About This Home
This home is located at 1071 Mohr Ln Unit C, Concord, CA 94518 and is currently estimated at $377,455, approximately $346 per square foot. 1071 Mohr Ln Unit C is a home located in Contra Costa County with nearby schools including Fair Oaks Elementary School, Oak Grove Middle School, and Ygnacio Valley High School.
Ownership History
Date
Name
Owned For
Owner Type
Purchase Details
Closed on
Feb 14, 2005
Sold by
Poncia Estela A
Bought by
Poncia Juan Pablo
Current Estimated Value
Purchase Details
Closed on
Jul 23, 2003
Sold by
Collazos Alexandra
Bought by
Poncia Estela A
Purchase Details
Closed on
Sep 26, 2002
Sold by
Carey Cathleen S
Bought by
Collazos Alexandra
Home Financials for this Owner
Home Financials are based on the most recent Mortgage that was taken out on this home.
Original Mortgage
$160,000
Interest Rate
6.17%
Mortgage Type
Stand Alone First
Purchase Details
Closed on
Jan 24, 1994
Sold by
Freitas Gary R
Bought by
Carey Cathleen S
Home Financials for this Owner
Home Financials are based on the most recent Mortgage that was taken out on this home.
Original Mortgage
$75,700
Interest Rate
7.21%
Mortgage Type
FHA
Create a Home Valuation Report for This Property
The Home Valuation Report is an in-depth analysis detailing your home's value as well as a comparison with similar homes in the area
Home Values in the Area
Average Home Value in this Area
Purchase History
| Date | Buyer | Sale Price | Title Company |
|---|---|---|---|
| Poncia Juan Pablo | -- | -- | |
| Poncia Estela A | -- | -- | |
| Collazos Alexandra | $200,000 | Placer Title | |
| Carey Cathleen S | $78,000 | Commonwealth Land Title Ins |
Source: Public Records
Mortgage History
| Date | Status | Borrower | Loan Amount |
|---|---|---|---|
| Previous Owner | Collazos Alexandra | $160,000 | |
| Previous Owner | Carey Cathleen S | $75,700 |
Source: Public Records
Tax History Compared to Growth
Tax History
| Year | Tax Paid | Tax Assessment Tax Assessment Total Assessment is a certain percentage of the fair market value that is determined by local assessors to be the total taxable value of land and additions on the property. | Land | Improvement |
|---|---|---|---|---|
| 2025 | $5,384 | $411,884 | $213,261 | $198,623 |
| 2024 | $5,273 | $403,809 | $209,080 | $194,729 |
| 2023 | $5,273 | $395,892 | $204,981 | $190,911 |
| 2022 | $5,192 | $388,130 | $200,962 | $187,168 |
| 2021 | $4,687 | $347,500 | $179,925 | $167,575 |
| 2019 | $4,452 | $325,000 | $168,275 | $156,725 |
| 2018 | $4,203 | $312,000 | $161,544 | $150,456 |
| 2017 | $3,769 | $280,000 | $144,975 | $135,025 |
| 2016 | $3,301 | $243,000 | $125,817 | $117,183 |
| 2015 | $2,943 | $212,500 | $110,025 | $102,475 |
| 2014 | $2,624 | $186,500 | $96,564 | $89,936 |
Source: Public Records
Map
Nearby Homes
- 1040 Mohr Ln Unit C
- 1356 Del Rio Cir Unit D
- 1045 Mohr Ln Unit B
- 1064 Mohr Ln Unit C
- 1369 Del Rio Cir Unit C
- 1459 Del Rio Cir Unit C
- 1013 Mohr Ln Unit 2
- 1042 Bermuda Dr
- 1096 Mohr Ln
- 1091 Mohr Ln Unit D
- 1035 Orange St
- 134 The Trees Dr
- 1086 Azalea Ln
- 2050 Monument Blvd
- 136 Cleopatra Dr
- 1218 Hookston Rd
- 1640 Amhurst Way
- 1110 Eureka Ln
- 1014 Bancroft Rd
- 1640 Apple Dr
- 1071 Mohr Ln Unit D
- 1071 Mohr Ln Unit B
- 1071 Mohr Ln Unit A
- 1069 Mohr Ln
- 1069 Mohr Ln Unit D
- 1069 Mohr Ln Unit C
- 1069 Mohr Ln Unit B
- 1069 Mohr Ln Unit A
- 1384 Tree Garden Place
- 1382 Tree Garden Place
- 1073 Mohr Ln Unit D
- 1073 Mohr Ln Unit C
- 1073 Mohr Ln Unit B
- 1073 Mohr Ln Unit A
- 1380 Tree Garden Place
- 1046 Mohr Ln Unit D
- 1046 Mohr Ln Unit C
- 1046 Mohr Ln Unit B
- 1046 Mohr Ln Unit A
- 1378 Tree Garden Place