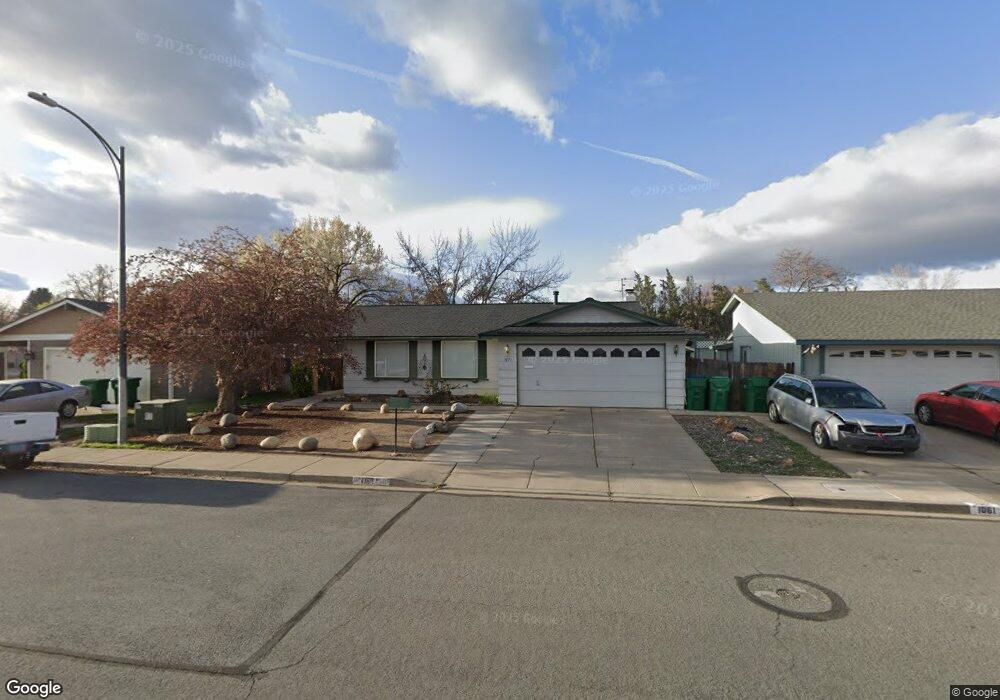
1071 Sage View Dr Sparks, NV 89434
O'Callaghan NeighborhoodEstimated Value: $431,582 - $495,000
4
Beds
2
Baths
1,549
Sq Ft
$294/Sq Ft
Est. Value
About This Home
This home is located at 1071 Sage View Dr, Sparks, NV 89434 and is currently estimated at $455,896, approximately $294 per square foot. 1071 Sage View Dr is a home located in Washoe County with nearby schools including Katherine Dunn Elementary School, George L Dilworth Middle School, and Edward C Reed High School.
Ownership History
Date
Name
Owned For
Owner Type
Purchase Details
Closed on
May 8, 2017
Sold by
Baker D Duane
Bought by
Avansino Dena
Current Estimated Value
Purchase Details
Closed on
Sep 17, 2010
Sold by
Brandon Wayne A
Bought by
Brandon Wayne A and The Wayne A Brandon Revocable Living Tru
Purchase Details
Closed on
Aug 5, 2005
Sold by
Kinney Holly A
Bought by
Karron Brandon Wayne and Karron Brandon
Purchase Details
Closed on
Apr 27, 2005
Sold by
Emery Kenneth George
Bought by
Iratcabal John Edward
Purchase Details
Closed on
Apr 25, 2005
Sold by
Iratcabal John Edward
Bought by
Kinney Holly
Purchase Details
Closed on
Apr 22, 2005
Sold by
Iratcabal Evelyn G
Bought by
Iratcabal John Edward
Purchase Details
Closed on
May 18, 2000
Sold by
Iratcabal Pedroli Elmer Gildo and Iratcabal Emery Jennifer
Bought by
Pedroli Elmer Gildo and Iratcabal John Edward
Purchase Details
Closed on
May 1, 1995
Sold by
Pedroli Elmer Gildo and Iratcabal John Edward
Bought by
Iratcabal Pedroli Elmer Gildo and Iratcabal Emery Jennifer
Create a Home Valuation Report for This Property
The Home Valuation Report is an in-depth analysis detailing your home's value as well as a comparison with similar homes in the area
Home Values in the Area
Average Home Value in this Area
Purchase History
| Date | Buyer | Sale Price | Title Company |
|---|---|---|---|
| Avansino Dena | -- | None Available | |
| Brandon Wayne A | -- | None Available | |
| Karron Brandon Wayne | $340,000 | -- | |
| Iratcabal John Edward | -- | Western Title Incorporated | |
| Kinney Holly | $230,000 | Western Title Incorporated | |
| Iratcabal John Edward | -- | Western Title Incorporated | |
| Pedroli Elmer Gildo | $35,000 | -- | |
| Iratcabal Pedroli Elmer Gildo | $22,500 | -- |
Source: Public Records
Tax History Compared to Growth
Tax History
| Year | Tax Paid | Tax Assessment Tax Assessment Total Assessment is a certain percentage of the fair market value that is determined by local assessors to be the total taxable value of land and additions on the property. | Land | Improvement |
|---|---|---|---|---|
| 2025 | $1,530 | $63,234 | $37,275 | $25,959 |
| 2024 | $1,530 | $59,626 | $32,620 | $27,006 |
| 2023 | $1,485 | $58,061 | $31,710 | $26,351 |
| 2022 | $1,442 | $50,029 | $27,475 | $22,554 |
| 2021 | $1,401 | $44,225 | $21,175 | $23,050 |
| 2020 | $1,359 | $44,173 | $20,510 | $23,663 |
| 2019 | $1,319 | $42,231 | $18,865 | $23,366 |
| 2018 | $1,281 | $36,774 | $13,405 | $23,369 |
| 2017 | $1,245 | $36,822 | $12,810 | $24,012 |
| 2016 | $1,212 | $37,318 | $12,355 | $24,963 |
| 2015 | $305 | $35,256 | $9,695 | $25,561 |
| 2014 | $1,149 | $33,124 | $8,435 | $24,689 |
| 2013 | -- | $30,761 | $6,055 | $24,706 |
Source: Public Records
Map
Nearby Homes
- 857 Cherry Tree Dr Unit 3
- 949 Crestwood Dr Unit 3
- 1218 Junction Dr
- 801 Woodglen Dr Unit 2
- 848 Parkside Dr Unit 1
- 1897 Bonita Vista Dr
- 1544 Woodhaven Ln
- 1973 Rio Tinto Dr
- 1728 Bluehaven Dr
- 675 Parlanti Ln Unit 52
- 675 Parlanti Ln Unit 124
- 675 Parlanti Ln Unit 42
- 675 Parlanti Ln
- 675 Parlanti Ln Unit 88
- 907 Camino Real Dr
- 1332 Coachman Ct
- 1970 Woodhaven Ln
- 385 Gleeson Way
- 370 O'Brien Way
- 684 Oakwood Dr Unit 3
- 1061 Sage View Dr
- 1081 Sage View Dr
- 1030 Robbie Way
- 1050 Robbie Way
- 1051 Sage View Dr
- 990 Robbie Way
- 1070 Robbie Way
- 1016 Paisley Ct
- 1056 Paisley Ct
- 1041 Sage View Dr
- 970 Robbie Way
- 1008 Sage View Dr
- 1064 Sage View Dr
- 1072 Sage View Dr
- 1024 Paisley Ct
- 1031 Sage View Dr
- 1080 Sage View Dr Unit 2
- 1048 Paisley Ct
- 998 Marracco Dr
- 1002 Sage View Dr