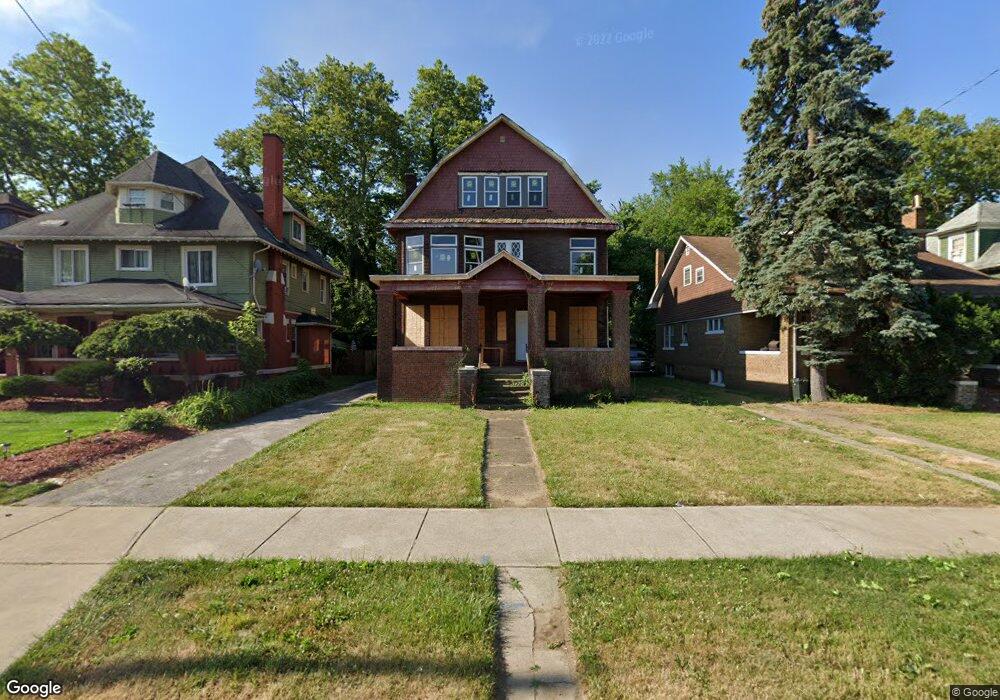
10710 Drexel Ave Cleveland, OH 44108
Glenville NeighborhoodEstimated Value: $92,168 - $173,000
6
Beds
4
Baths
2,788
Sq Ft
$41/Sq Ft
Est. Value
About This Home
This home is located at 10710 Drexel Ave, Cleveland, OH 44108 and is currently estimated at $115,542, approximately $41 per square foot. 10710 Drexel Ave is a home located in Cuyahoga County with nearby schools including Bolton, Anton Grdina School, and Andrew J. Rickoff School.
Ownership History
Date
Name
Owned For
Owner Type
Purchase Details
Closed on
Oct 30, 2014
Sold by
Cuyahoga County
Bought by
Edwards Booker T
Current Estimated Value
Purchase Details
Closed on
Apr 12, 1995
Sold by
Lewis Vera C
Bought by
Woods Walter L and Woods Ethel S
Home Financials for this Owner
Home Financials are based on the most recent Mortgage that was taken out on this home.
Original Mortgage
$55,100
Interest Rate
8.55%
Mortgage Type
New Conventional
Purchase Details
Closed on
May 14, 1990
Sold by
Highgate Jacquelyn
Bought by
Lewis Vera C
Purchase Details
Closed on
Jan 12, 1984
Sold by
Highgate Dyx Jacquelyn
Bought by
Highgate Jacquelyn
Purchase Details
Closed on
Aug 24, 1983
Sold by
Lewis Vera C
Bought by
Highgate Dyx Jacquelyn
Purchase Details
Closed on
Aug 13, 1976
Sold by
Highgate Jacquelyn N
Bought by
Lewis Vera C
Purchase Details
Closed on
Jan 1, 1975
Bought by
Highgate Jacquelyn N
Create a Home Valuation Report for This Property
The Home Valuation Report is an in-depth analysis detailing your home's value as well as a comparison with similar homes in the area
Home Values in the Area
Average Home Value in this Area
Purchase History
| Date | Buyer | Sale Price | Title Company |
|---|---|---|---|
| Edwards Booker T | $3,500 | None Available | |
| Woods Walter L | $58,000 | -- | |
| Lewis Vera C | -- | -- | |
| Highgate Jacquelyn | -- | -- | |
| Highgate Dyx Jacquelyn | -- | -- | |
| Lewis Vera C | $10,000 | -- | |
| Highgate Jacquelyn N | -- | -- |
Source: Public Records
Mortgage History
| Date | Status | Borrower | Loan Amount |
|---|---|---|---|
| Previous Owner | Woods Walter L | $55,100 |
Source: Public Records
Tax History Compared to Growth
Tax History
| Year | Tax Paid | Tax Assessment Tax Assessment Total Assessment is a certain percentage of the fair market value that is determined by local assessors to be the total taxable value of land and additions on the property. | Land | Improvement |
|---|---|---|---|---|
| 2024 | $548 | $8,190 | $4,025 | $4,165 |
| 2023 | $337 | $4,350 | $2,210 | $2,140 |
| 2022 | $335 | $4,340 | $2,205 | $2,135 |
| 2021 | $332 | $4,340 | $2,210 | $2,140 |
| 2020 | $913 | $3,570 | $1,820 | $1,750 |
| 2019 | $292 | $10,200 | $5,200 | $5,000 |
| 2018 | $1,186 | $3,570 | $1,820 | $1,750 |
| 2017 | $1,551 | $4,210 | $1,090 | $3,120 |
| 2016 | $1,215 | $7,360 | $1,090 | $6,270 |
| 2015 | -- | $7,360 | $1,090 | $6,270 |
| 2014 | -- | $8,160 | $1,190 | $6,970 |
Source: Public Records
Map
Nearby Homes
- 10718 Drexel Ave
- 10842 Grantwood Ave
- 10630 Tacoma Ave
- 10927 Grantwood Ave
- 10404 South Blvd
- 10802 Hampden Ave
- 1130 E 111th St
- 10202 North Blvd
- 10313 Pierpont Ave
- 10209 Ostend Ave
- 994 Parkwood Dr
- 10515 Greenlawn Ave
- 10121 Somerset Ave
- 1144 E 112th St
- 10114 Parkgate Ave
- 10213 Hampden Ave
- 1190 E 112th St
- 1140 E 113th St
- 10321 Kempton Ave
- 10014 Somerset Ave
- 10714 Drexel Ave
- 10708 Drexel Ave
- 10700 Drexel Ave
- 1002310025 North Blvd
- 10711 Grantwood Ave
- 10707 Grantwood Ave
- 10618 Drexel Ave
- 10703 Grantwood Ave
- 10719 Grantwood Ave
- 10802 Drexel Ave
- 10619 Grantwood Ave
- 10614 Drexel Ave
- 10615 Grantwood Ave
- 10709 Drexel Ave
- 10713 Drexel Ave
- 10705 Drexel Ave
- 10803 Grantwood Ave
- 10615 Drexel Ave
- 10808 Drexel Ave
- 10717 Drexel Ave