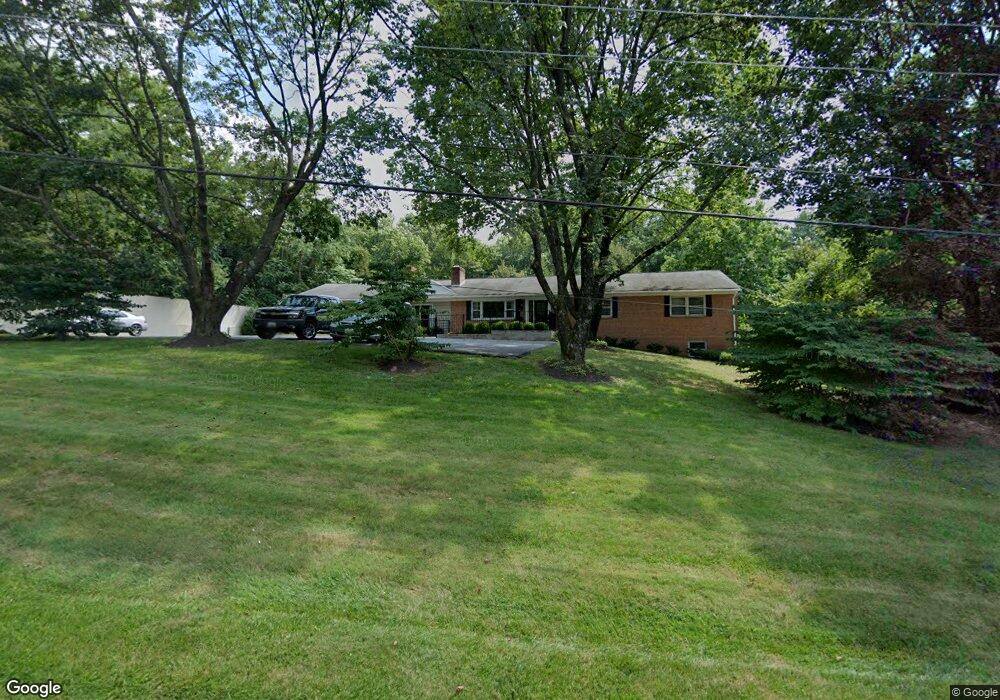
10711 Harding Rd Laurel, MD 20723
Estimated Value: $964,946
--
Bed
4
Baths
3,450
Sq Ft
$280/Sq Ft
Est. Value
About This Home
This home is located at 10711 Harding Rd, Laurel, MD 20723 and is currently estimated at $964,946, approximately $279 per square foot. 10711 Harding Rd is a home located in Howard County with nearby schools including Hammond Elementary School, Hammond Middle School, and Reservoir High School.
Ownership History
Date
Name
Owned For
Owner Type
Purchase Details
Closed on
Jul 14, 2011
Sold by
Hikmat Rafat J
Bought by
Sessler Victoria V and Sessler John E
Current Estimated Value
Home Financials for this Owner
Home Financials are based on the most recent Mortgage that was taken out on this home.
Original Mortgage
$1,300,000
Outstanding Balance
$894,361
Interest Rate
4.51%
Mortgage Type
Unknown
Estimated Equity
$70,585
Purchase Details
Closed on
Jun 18, 2010
Sold by
Valentine Eugene T
Bought by
Sessler Victoria V and Sessler John E
Purchase Details
Closed on
Aug 26, 2004
Sold by
Hikmat Rafat J
Bought by
Valentine Eugene T and Valentine Sessler Victoria
Purchase Details
Closed on
Aug 25, 2004
Sold by
Hikmat Rafat J
Bought by
Valentine Eugene T and Valentine Sessler Victoria
Purchase Details
Closed on
Sep 17, 2002
Sold by
Joseph Heath Michael
Bought by
Hikmat Rafat J
Create a Home Valuation Report for This Property
The Home Valuation Report is an in-depth analysis detailing your home's value as well as a comparison with similar homes in the area
Home Values in the Area
Average Home Value in this Area
Purchase History
| Date | Buyer | Sale Price | Title Company |
|---|---|---|---|
| Sessler Victoria V | -- | Lakeview Title Company | |
| Sessler Victoria V | -- | -- | |
| Valentine Eugene T | $569,100 | -- | |
| Valentine Eugene T | $569,100 | -- | |
| Hikmat Rafat J | $490,000 | -- |
Source: Public Records
Mortgage History
| Date | Status | Borrower | Loan Amount |
|---|---|---|---|
| Open | Sessler Victoria V | $1,300,000 | |
| Closed | Hikmat Rafat J | -- |
Source: Public Records
Tax History Compared to Growth
Tax History
| Year | Tax Paid | Tax Assessment Tax Assessment Total Assessment is a certain percentage of the fair market value that is determined by local assessors to be the total taxable value of land and additions on the property. | Land | Improvement |
|---|---|---|---|---|
| 2025 | $11,308 | $732,500 | $240,700 | $491,800 |
| 2024 | $11,308 | $716,967 | $0 | $0 |
| 2023 | $10,899 | $701,433 | $0 | $0 |
| 2022 | $10,596 | $685,900 | $240,700 | $445,200 |
| 2021 | $10,003 | $665,267 | $0 | $0 |
| 2020 | $10,003 | $644,633 | $0 | $0 |
| 2019 | $9,706 | $624,000 | $192,400 | $431,600 |
| 2018 | $9,014 | $613,167 | $0 | $0 |
| 2017 | $8,834 | $624,000 | $0 | $0 |
| 2016 | -- | $591,500 | $0 | $0 |
| 2015 | -- | $591,500 | $0 | $0 |
| 2014 | -- | $591,500 | $0 | $0 |
Source: Public Records
Map
Nearby Homes
- 10681 Old Bond Mill Rd
- 10571 Scaggsville Rd
- 10781 Scaggsville Rd
- 10520 Scaggsville Rd
- 10417 Leslie Dr
- 8445 Early Bud Way
- 10687 Glen Hannah Dr
- 10665 Glen Hannah Dr
- 8719 Susini Dr
- 10948 Scaggsville Rd
- 10633 Delfield Ct
- 8200 Splashing Brook Ct
- 8208 Sandy Stream Rd
- 7688 Blackbriar Way
- 16106 Julie Ln
- 7840 Blackbriar Way
- 7858 Blackbriar Way
- 7862 Blackbriar Way
- 7700 Cultivator Rd
- 7866 Blackbriar Way
- 10671 Harding Rd
- 10721 Harding Rd
- 10701 Harding Rd
- 10743 Harding Rd
- 10703 Harding Rd
- 10798 Harding Rd
- 10716 Jordans Dr
- 10730 Harding Rd
- 10715 Jordans Dr
- 10810 Harding Rd
- 10712 Jordans Dr
- 10696 Harding Rd
- 10706 Harding Rd
- 10693 Harding Rd
- 10711 Jordans Dr
- 10695 Harding Rd
- 10710 Harding Rd
- 10708 Jordans Dr
- 10688 Harding Rd