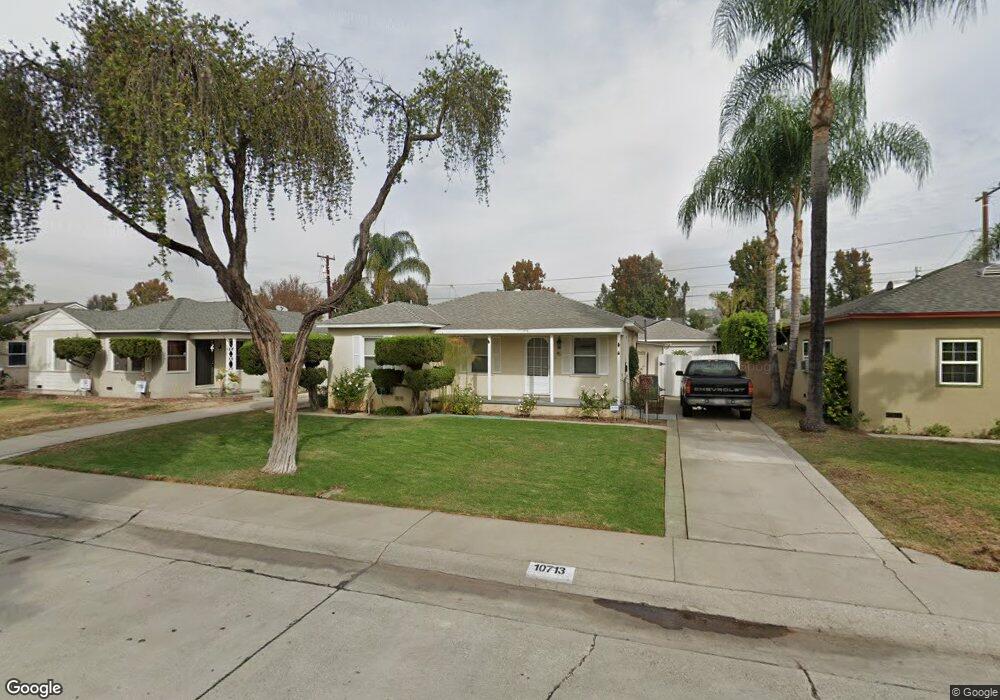
10713 Rose Dr Whittier, CA 90606
West Whittier NeighborhoodEstimated Value: $700,701 - $772,000
2
Beds
1
Bath
934
Sq Ft
$797/Sq Ft
Est. Value
About This Home
This home is located at 10713 Rose Dr, Whittier, CA 90606 and is currently estimated at $744,175, approximately $796 per square foot. 10713 Rose Dr is a home located in Los Angeles County with nearby schools including Orange Grove Elementary School, Walter F. Dexter Middle School, and Whittier High School.
Ownership History
Date
Name
Owned For
Owner Type
Purchase Details
Closed on
May 24, 2005
Sold by
Marquez Jesus
Bought by
Marquez Jesus and Marquez Carolina
Current Estimated Value
Home Financials for this Owner
Home Financials are based on the most recent Mortgage that was taken out on this home.
Original Mortgage
$217,000
Outstanding Balance
$112,417
Interest Rate
5.74%
Mortgage Type
New Conventional
Estimated Equity
$631,758
Purchase Details
Closed on
Feb 19, 2004
Sold by
Crosson David
Bought by
Marquez Jesus and Marquez Carolina
Home Financials for this Owner
Home Financials are based on the most recent Mortgage that was taken out on this home.
Original Mortgage
$200,000
Interest Rate
4.08%
Mortgage Type
Purchase Money Mortgage
Purchase Details
Closed on
Apr 5, 1999
Sold by
Lopez Ruben
Bought by
Crosson David and Crosson Laurie
Home Financials for this Owner
Home Financials are based on the most recent Mortgage that was taken out on this home.
Original Mortgage
$155,220
Interest Rate
6.98%
Mortgage Type
FHA
Create a Home Valuation Report for This Property
The Home Valuation Report is an in-depth analysis detailing your home's value as well as a comparison with similar homes in the area
Home Values in the Area
Average Home Value in this Area
Purchase History
| Date | Buyer | Sale Price | Title Company |
|---|---|---|---|
| Marquez Jesus | -- | Investors Title | |
| Marquez Jesus | $300,000 | Investors Title Company | |
| Crosson David | $156,500 | Chicago Title |
Source: Public Records
Mortgage History
| Date | Status | Borrower | Loan Amount |
|---|---|---|---|
| Open | Marquez Jesus | $217,000 | |
| Closed | Marquez Jesus | $200,000 | |
| Previous Owner | Crosson David | $155,220 |
Source: Public Records
Tax History Compared to Growth
Tax History
| Year | Tax Paid | Tax Assessment Tax Assessment Total Assessment is a certain percentage of the fair market value that is determined by local assessors to be the total taxable value of land and additions on the property. | Land | Improvement |
|---|---|---|---|---|
| 2025 | $5,308 | $426,514 | $335,958 | $90,556 |
| 2024 | $5,308 | $418,152 | $329,371 | $88,781 |
| 2023 | $5,289 | $409,954 | $322,913 | $87,041 |
| 2022 | $5,222 | $401,917 | $316,582 | $85,335 |
| 2021 | $5,090 | $394,037 | $310,375 | $83,662 |
| 2019 | $4,973 | $382,352 | $301,170 | $81,182 |
| 2018 | $4,807 | $374,856 | $295,265 | $79,591 |
| 2016 | $4,602 | $360,301 | $283,800 | $76,501 |
| 2015 | $4,516 | $354,890 | $279,538 | $75,352 |
| 2014 | $4,433 | $347,939 | $274,063 | $73,876 |
Source: Public Records
Map
Nearby Homes
- 5903 Redman Ave
- 11302 Maple St
- 5518 Norwalk Blvd
- 10825 Loch Avon Dr
- 11232 Dorland Dr
- 11273 Dorland Dr
- 11511 Beverly Dr
- 10943 Loch Lomond Dr
- 5593 Pioneer Blvd Unit 18
- 10050 Obregon St
- 11447 Broadway Ave
- 5729 Juarez Ave
- 5577 Pioneer Blvd Unit 5
- 5315 Bihr Ct
- 5307 Woodward Ln
- 10013 Obregon St
- 5523 Pioneer Blvd Unit 30
- 10605 Cordoba Ct
- 6225 Gretna Ave
- 6266 Western Ave