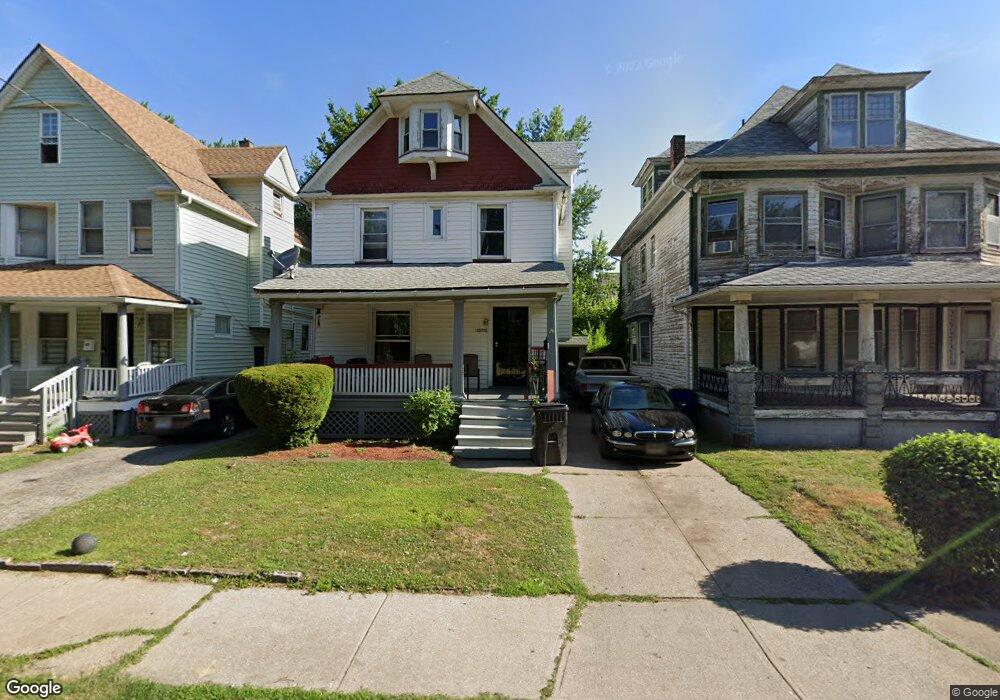
10715 Tacoma Ave Cleveland, OH 44108
Glenville NeighborhoodEstimated Value: $56,000 - $86,000
3
Beds
1
Bath
1,329
Sq Ft
$53/Sq Ft
Est. Value
About This Home
This home is located at 10715 Tacoma Ave, Cleveland, OH 44108 and is currently estimated at $71,047, approximately $53 per square foot. 10715 Tacoma Ave is a home located in Cuyahoga County with nearby schools including Bolton, Anton Grdina School, and Andrew J. Rickoff School.
Ownership History
Date
Name
Owned For
Owner Type
Purchase Details
Closed on
Oct 22, 2014
Sold by
Rivers Stefanie and Rivers Lorin
Bought by
Minor Eric
Current Estimated Value
Purchase Details
Closed on
Sep 19, 2014
Sold by
Thomas Norman L and Thomas Pamela M
Bought by
Minor Eric
Purchase Details
Closed on
Sep 9, 2014
Sold by
Redmon I Susan
Bought by
Minor Eric
Purchase Details
Closed on
Feb 13, 2014
Sold by
Gay John L and Gay Denice
Bought by
Minor Eric
Purchase Details
Closed on
Dec 18, 2013
Sold by
Thomas Benjamin C and Thomas Dawn
Bought by
Minor Eric
Purchase Details
Closed on
Sep 6, 2013
Sold by
Estate Of James W Gary
Bought by
Gary John L
Purchase Details
Closed on
Aug 14, 2013
Sold by
Estate Of Rachael M Gay
Bought by
Gay James W
Purchase Details
Closed on
Jul 18, 2012
Sold by
Estate Of Marion J Taylor
Bought by
Thomas Norman L and Thomas Benjamin C
Purchase Details
Closed on
May 7, 1980
Sold by
Marion Taylor C and Marion Jane
Bought by
Taylor Marion J
Purchase Details
Closed on
Jan 1, 1975
Bought by
Marion Taylor C and Marion Jane
Create a Home Valuation Report for This Property
The Home Valuation Report is an in-depth analysis detailing your home's value as well as a comparison with similar homes in the area
Home Values in the Area
Average Home Value in this Area
Purchase History
| Date | Buyer | Sale Price | Title Company |
|---|---|---|---|
| Minor Eric | -- | None Available | |
| Minor Eric | $4,300 | None Available | |
| Minor Eric | $4,300 | None Available | |
| Minor Eric | $4,300 | None Available | |
| Minor Eric | $2,867 | Attorney | |
| Minor Eric | $2,867 | Attorney | |
| Gary John L | -- | None Available | |
| Gay James W | -- | None Available | |
| Thomas Norman L | -- | None Available | |
| Taylor Marion J | -- | -- | |
| Marion Taylor C | -- | -- |
Source: Public Records
Tax History Compared to Growth
Tax History
| Year | Tax Paid | Tax Assessment Tax Assessment Total Assessment is a certain percentage of the fair market value that is determined by local assessors to be the total taxable value of land and additions on the property. | Land | Improvement |
|---|---|---|---|---|
| 2024 | $216 | $13,090 | $2,660 | $10,430 |
| 2023 | $394 | $5,190 | $1,440 | $3,750 |
| 2022 | $391 | $5,180 | $1,435 | $3,745 |
| 2021 | $387 | $5,180 | $1,440 | $3,750 |
| 2020 | $369 | $4,270 | $1,190 | $3,080 |
| 2019 | $341 | $12,200 | $3,400 | $8,800 |
| 2018 | $340 | $4,270 | $1,190 | $3,080 |
| 2017 | $448 | $5,430 | $740 | $4,690 |
| 2016 | $444 | $5,430 | $740 | $4,690 |
| 2015 | $508 | $5,430 | $740 | $4,690 |
| 2014 | $508 | $6,030 | $810 | $5,220 |
Source: Public Records
Map
Nearby Homes
- 10718 Drexel Ave
- 10630 Tacoma Ave
- 10842 Grantwood Ave
- 10802 Hampden Ave
- 10404 South Blvd
- 10927 Grantwood Ave
- 10202 North Blvd
- 1130 E 111th St
- 10213 Hampden Ave
- 10209 Ostend Ave
- 1144 E 112th St
- 10121 Somerset Ave
- 1190 E 112th St
- 10313 Pierpont Ave
- 10114 Parkgate Ave
- 1140 E 113th St
- 994 Parkwood Dr
- 10014 Somerset Ave
- 10515 Greenlawn Ave
- 1261 E 102nd St
- 10711 Tacoma Ave
- 10719 Tacoma Ave
- 10707 Tacoma Ave
- 10801 Tacoma Ave
- 10716 Grantwood Ave
- 10705 Tacoma Ave
- 10720 Grantwood Ave
- 10712 Grantwood Ave
- 10708 Grantwood Ave
- 10701 Tacoma Ave
- 10809 Tacoma Ave
- 10802 Grantwood Ave
- 10702 Grantwood Ave
- 10704 Tacoma Ave
- 10708 Tacoma Ave
- 10813 Tacoma Ave
- 10806 Grantwood Ave
- 10624 Grantwood Ave
- 10804 Tacoma Ave
- 10619 Tacoma Ave